


Japanese Yen, USD/JPY, AUD/JPY - Talking Points
- USD/JPY has pulled back from multi year highs as the Yen finds footing
- AUD/JPY momentum signals are mixed between short and medium to long-term
- Japanese Yen has consolidated against USD and AUD. Where to next?

USD/JPY – Technical Analysis
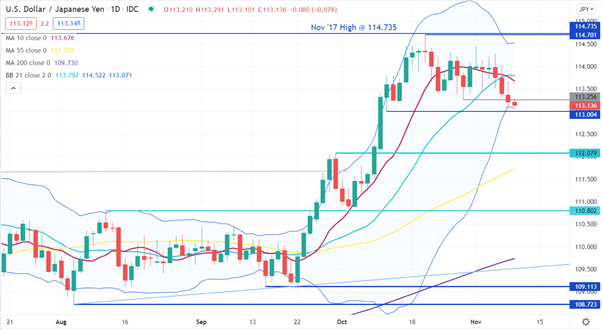
USD/JPY made a high in mid-October at 114.701 that was just shy of the November 2017 peak of 114.735. These 2 levels may offer resistance on a move higher.
The price has recently moved under a previous low of 113.256 and is moving towards a past low of 113.004, that might provide support. Below that, there are 2 pivot points at 112.079 and 110.802 that are potential support.
Recently, the price just touched the lower band of the 21-day simple moving average (SMA) based Bollinger Band. It has since moved back inside the lower band. As the SMA and the lower band start re-adjusting lower, it could suggest that the move lower has not yet been too volatile for the market.
It’s possible that the narrowing of the width of the Bollinger Bands themselves may suggest a period of consolidation.
AUD/JPY – Technical Analysis
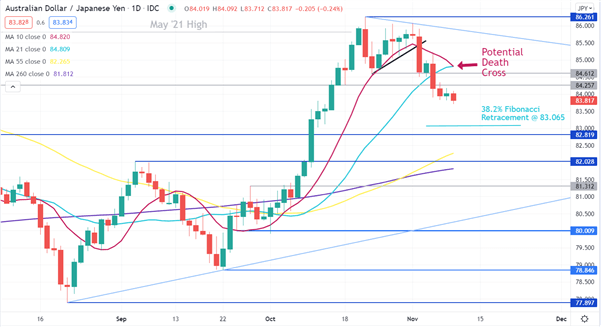
AUD/JPY made a 3 year high last month, it then consolidated sideways before it broke below a short-term ascending trend line. That move lower also went through a previous low at 84.612 and a pivot point at 84.257.
The price has moved below the short-term 10 and 21-day simplemoving averages (SMA). The 10-day SMA is close to crossing the 21-day SMA which would a be short time frame Death Cross. This could suggest short-term bearish momentum is potentially unfolding.
The medium and long-term SMAs remain well below the market, as represented by the 55-day and 260-day SMAs. This may imply that while short-term momentum appears bearish, medium and long-term momentum will need further movement to turn negative.
Below the market, potential support might be at the 38.2% Fibonacci retracement of the move from 77.897 to 86.261 at 83.065. Further down, the pivot points at 82.819 and 82.028 are possible support levels.
On the topside, the high at 86.261, as well as the 10 and 21-day SMAs at 84.810 may offer resistance.
--- Written by Daniel McCarthy, Strategist for DailyFX.com
To contact Daniel, use the comments section below or @DanMcCathyFX on Twitter


