


US Dollar, USD/SGD, USD/IDR, USD/THB, USD/PHP – ASEAN Technical Analysis
- US Dollar now on the defensive against most ASEAN currencies
- USD/SGD ends key uptrends, USD/THB upside momentum fading
- USD/PHP consolidating, USD/IDR turns focus to early 2021 lows

Singapore Dollar Technical Outlook
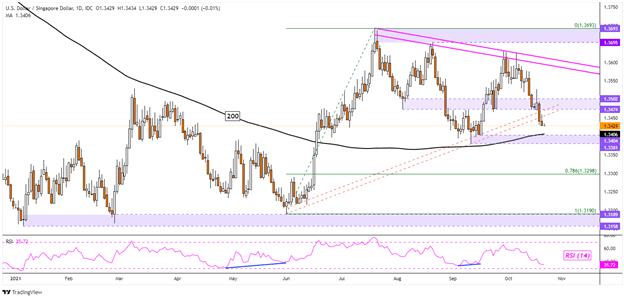
The US Dollar continued losing ground to the Singapore Dollar since late September. Recently, USD/SGD broke under rising support from June, ending the uptrend since then. Now, the downtrend since July is in focus. Confirmation of the breakout is lacking. The pair is facing key support levels below, starting with the 200-day Simple Moving Average (SMA).
This also includes the 1.3381 – 1.3404 support zone, made up of September lows. As such, the pair could be heading for a consolidative state. Breaking under support exposes the 78.6% Fibonacci extension at 1.3298. Rising back above the 1.3474 – 1.3502 inflection zone could open the door to reversing broadly higher.
USD/SGD Daily Chart
Indonesian Rupiah Technical Outlook
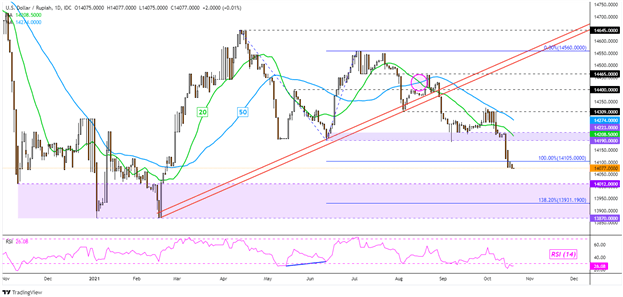
The US Dollar continues to lose ground against the Indonesian Rupiah, with USD/IDR having confirmed a breakout under the key 14190 – 14223 support zone. Prices recently took out the 100% Fibonacci extension at 14105, exposing lows from earlier this year. The latter make for a fairly wide range of potential support, somewhere between 13870 and 14012.
As such, while the near-term technical bias seems favored to the downside, the broader outlook remains fairly neutral. USD/IDR remains unchanged since where it was in November 2020, almost one year ago. A bearish crossover between the 20- and 50-day SMAs may act as key resistance in the event of a turn higher.
USD/IDR Daily Chart
Thai Baht Technical Outlook
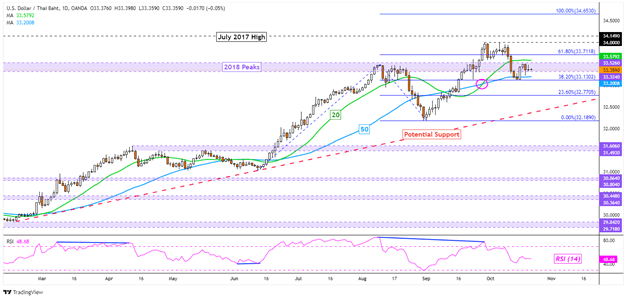
The US Dollar has been consolidating against the Thai Baht around its highest price since peaks from 2018. USD/THB’s aggressive uptrend since February still remains in play, but the pace and momentum has been notably fading. The most recent leg lower was accompanied with negative RSI divergence after prices stalled at 34.00.
Still, a bullish crossover remains between the 20- and 50-day SMAs, keeping the technical outlook biased higher. Keep a close eye on the latter line. A breakout under it could hint a extending losses, placing the focus on a potential rising trendline from earlier this year. Otherwise, uptrend resumption exposes the July 2017 high at 34.149 for potential resistance.

USD/THB Daily Chart
Philippine Peso Technical Outlook
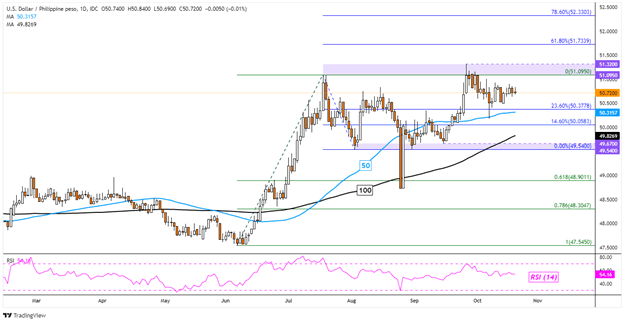
The US Dollar continues to consolidate against the Philippine Peso, albeit with a cautious upside bias since June. USD/PHP has been idling under the 51.32 – 51.09 resistance zone since the middle of September, but the pair has been broadly ranging since July with key support between 49.54 and 49.67. The slopes of the 50- and 100-day SMAs remain positive, hinting at an upward bias.
Still, until a breakout above or below the wide 51.32 – 49.54 zone is achieved, USD/PHP could remain in a consolidative state. Immediate support appears to be the 23.6% Fibonacci extension at 50.37. Breaking under exposes September lows. A breakout above the September high could open the door to testing the 61.8% extension at 51.73.
USD/PHP Daily Chart
--- Written by Daniel Dubrovsky, Strategist for DailyFX.com
To contact Daniel, use the comments section below or @ddubrovskyFX on Twitter
Trade Smarter - Sign up for the DailyFX Newsletter
Receive timely and compelling market commentary from the DailyFX team


