


S&P 500, Dow Jones, Technical Analysis, Retail Trader Positioning - Talking Points
- Retail traders shift back to selling the S&P 500 and Dow Jones
- If this trend in positioning continues, the indices may keep rising
- Both of the indices are nearing record highs and key resistance

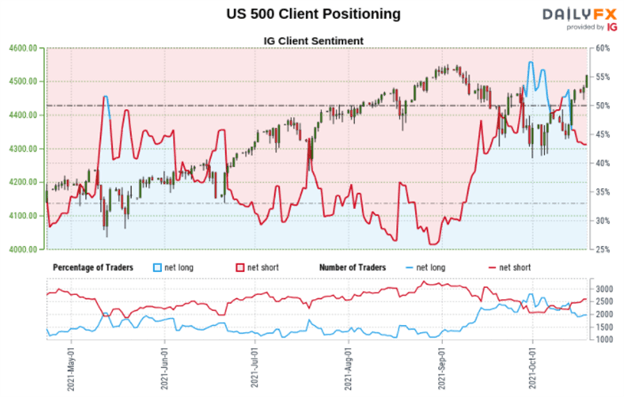
Taking a look at IG Client Sentiment (IGCS), retail investors are back to tending to sell the major benchmark stock indices on Wall Street. These include the S&P 500 and Dow Jones. IGCS tends to be a contrarian indicator. This means that if retail traders continue to sell into recent price action, there could be more room for these indices to extend gains. To learn more about how you can use this tool in your own trading strategy, check out last week’s recording of my webinar on IGCS.
S&P 500 Sentiment Outlook - Bullish
The IGCS gauge shows that roughly 45% of retail traders are net-long the S&P 500. Downside exposure decreased by 0.89% compared to yesterday while simultaneously increasing 14.74% compared to a week ago. Since the majority of traders are now net-short, this hints that prices may continue rising. Recent shifts in positioning are further underscoring a bullish contrarian trading bias.

Technical Analysis
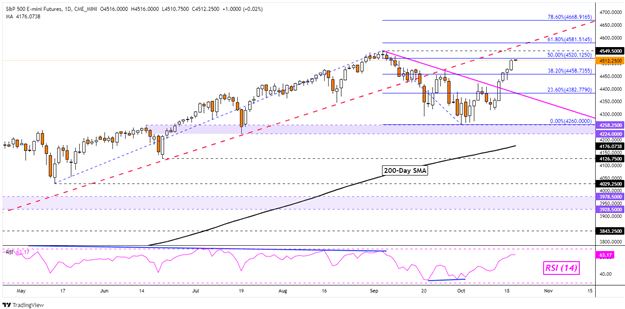
S&P 500 futures extended an advance beyond a near-term falling trendline from early September. This has brought the index very close to the all-time high of 4549. This does mean that the S&P 500 may face key resistance in the coming days. This includes a former rising support line from March, which could establish itself as new resistance. A turn back lower, with confirmation, may place the focus on the September low at 4260. Otherwise, the 61.8% and 78.6% Fibonacci extensions sit at 4581 and 4668 respectively.
S&P 500 Futures Daily Chart
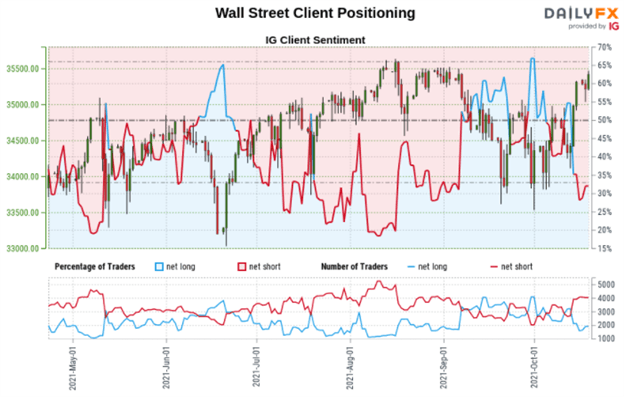
Dow Jones Sentiment Outlook - Bullish
The IGCS gauge implies that about 32% of retail traders are net-short the Dow Jones. Downside exposure increased by 0.85% and 37.48% over a daily and weekly basis respectively. Since the majority of retail traders are net-short, prices may continue rising. The recent changes in sentiment are further underscoring a bullish contrarian trading bias.
Technical Analysis
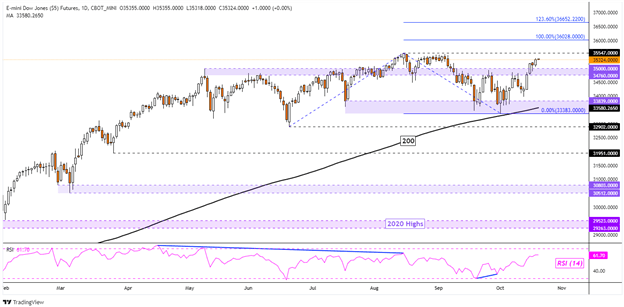
Recent gains in Dow Jones futures have brought the index just shy of the all-time high at 35547. This followed a bounce off the 33839 – 33383 support zone and the 200-period Simple Moving Average. A rejection of the all-time high may send prices lower towards the long-term SMA. Otherwise, a breakout higher with confirmation exposes the 100% and 123.6% Fibonacci extension levels at 36028 and 36652 respectively.
Dow Jones Futures Daily Chart
*IG Client Sentiment Charts and Positioning Data Used from October 19th Report
--- Written by Daniel Dubrovsky, Strategist for DailyFX.com
To contact Daniel, use the comments section below or @ddubrovskyFX on Twitter
Trade Smarter - Sign up for the DailyFX Newsletter
Receive timely and compelling market commentary from the DailyFX team


