


Dow Jones, S&P 500, Technical Analysis, Retail Trader Positioning - Talking Points
- Retail traders continue buying into recent Dow Jones, S&P 500 losses
- This is shown via IG Client Sentiment, usually a contrarian indicator
- If this trend continues, these US benchmark stock indices are at risk

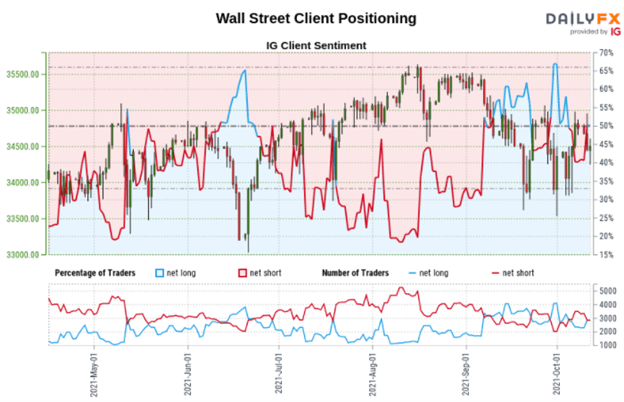
Taking a glance at IG Client Sentiment (IGCS), retail traders appear to be increasing upside exposure on Wall Street. These include major benchmark stock indices such as the Dow Jones and S&P 500. IGCS is usually a contrarian indicator. This implies that if investors keep buying into recent price action, there may be room for further losses in these indices. To learn more about using IGCS in your own trading strategy, check out the recording of this week’s webinar that I hosted.
Dow Jones Sentiment Outlook - Bearish
The IGCS gauge implies that about 49% of retail traders are net-long the Dow Jones. Upside exposure has increased by 25.71% and 0.87% over a daily and weekly basis respectively. We typically take a contrarian view to crowd sentiment. Since most traders are net-short, this hints that prices may rise. However, recent shifts in positioning warn that prices may soon reverse lower.
Technical Analysis
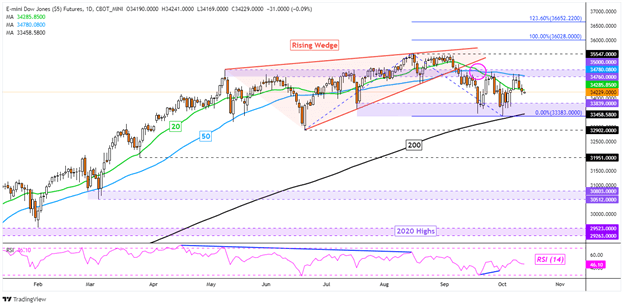
The Dow Jones is facing conflicting technical cues, but the near-term bias seems to be pointing lower. In September, the index broke under a bearish Rising Wedge chart formation. This was followed by a bearish Death Cross between the 20- and 50-day Simple Moving Averages. Still, key support holds as the 33383 – 33839 zone. This is as the 200-day line closes in. The latter could reinstate the dominant focus to the upside. Otherwise, closing under it risks opening the door to a broader turn lower. Resuming the uptrend entails a close above the all-time high at 35547.
Dow Jones Futures Daily Chart
S&P 500 Sentiment Outlook - Bearish
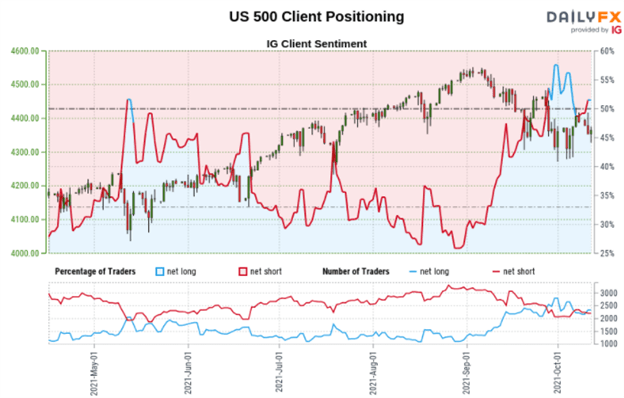
The IGCS gauge shows that roughly 52% of retail traders are net-long the S&P 500. Downside exposure has declined by 5.81% and 2.10% over a daily and weekly basis respectively. Since the majority of retail traders are now net-long, the S&P could extend recent losses. The combination of this and recent shifts in retail trader positioning are underscoring the outlook to the downside.

Technical Analysis
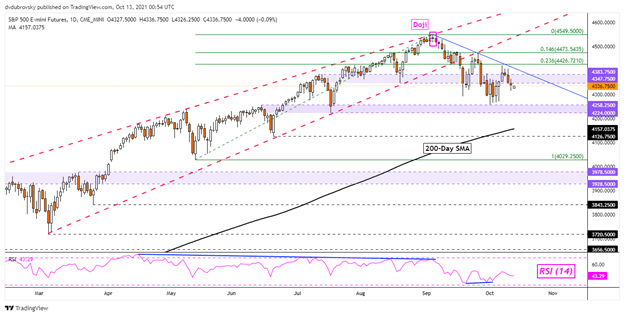
S&P 500 futures remain in a near-term downtrend since early September. A falling trendline from then seems to be playing out as key resistance. Key support sits below as the 4224 – 4258 inflection zone. Just below that is the 200-day SMA. The latter could pivot prices higher, reinstating the dominant uptrend. Resuming gains since March 2020 entails clearing the all-time high at 4549.50. Confirming a breakout above the falling trendline could be a signal that prices pivot higher in the near-term. Keep a close eye on RSI, positive divergence may emerge if prices extend losses. That may hint at a turning point to come.
S&P 500 Futures Daily Chart
*IG Client Sentiment Charts and Positioning Data Used from October 13th Report
--- Written by Daniel Dubrovsky, Strategist for DailyFX.com
To contact Daniel, use the comments section below or @ddubrovskyFX on Twitter
Trade Smarter - Sign up for the DailyFX Newsletter
Receive timely and compelling market commentary from the DailyFX team


