


New Zealand Dollar, NZD/USD, EUR/NZD, NZD/CAD - Talking Points
- NZD/USD is pushing to make a new high but faces resistance
- A volatility break-out has EUR/NZD testing new boundaries
- NZD/CAD seem to have a thing for ranges. Will it continue?
Introduction to Technical Analysis
Support and Resistance
Recommended by Daniel McCarthy
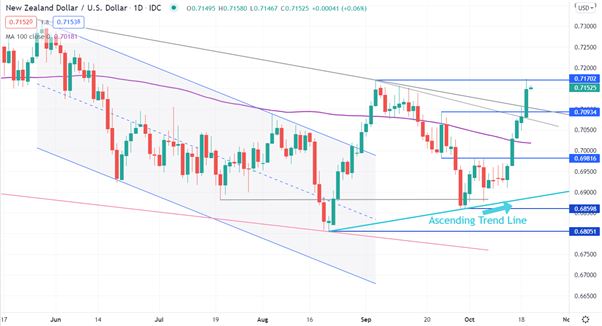
NZD/USD TECHNICAL ANALYSIS
Since making a low for the year in August at 0.68051, NZD/USD first broke up through the descending trend channel. Then established a range, and now could potentially be setting up an ascending trend channel.
The price stalled on Tuesday at a previous high at 0.71702 and this level may offer resistance. A move above this level would be a higher high that might establish an ascending trend line that could run parallel with the rising trend line from September on the chart below. The latter was established with a higher low of 0.68598 from the end of last month.
If NZD/USD does move lower, there is possible support at the pivot points of 0.70934, 0.69816 and potentially at the previous lows of 0.68598 and 0.68051.
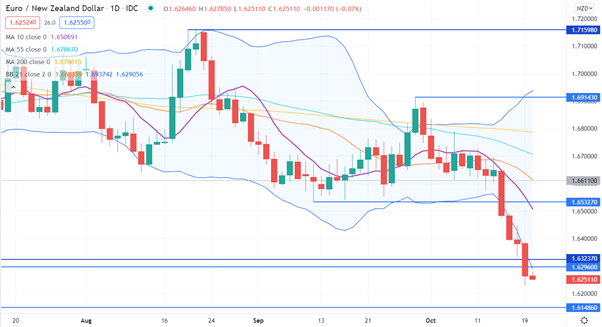
EUR/NZD TECHNICAL ANALYSIS
Volatility has exploded in EUR/NZD and the New Zealand Dollar has made a 4 year high against the Euro.
The blowout in volatility is illustrated by the width in the Bollinger Band s based off the 21-day simple moving average (SMA). The price remains below the lower band of Bollinger Band and if it closes inside the lower band it might signal a pause in bearishness.
The chart shows the 10-day, 21-day, 55-day and 200-day SMAs. After this move lower, all these SMAs have a negative slope, which can indicate bearish momentum. Every other short, medium and long term SMA, from 5 to 260 days (not illustrated), has a negative slope.
The next level of support is potentially at the September 2017 low of 1.61486. On the topside, the pivot points from the March 2019 low of 1.6296 and February 2021 low of 1.63237 may offer resistance.

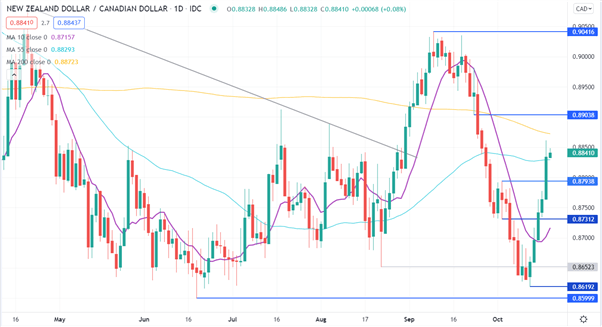
NZD/CAD TECHNICAL ANALYSIS
NZD/CAD has rallied to be near the middle of the recent range. It has just moved above the 55-day SMA which could indicate bullish momentum is evolving. The 200-day SMA is currently at 0.88723 and may offer resistance.
Further resistance might be at a pivot point of 0.89038 and the previous high of 0.90416. On the downside, potential support may lie at the pivot points of 0.87938 and 0.87312 or at the previous lows of 0.86192 and 0.85999.
--- Written by Daniel McCarthy, Strategist for DailyFX.com
To contact Daniel, use the comments section below or @DanMcCathyFX on Twitte


