


New Zealand Dollar, NZD/USD, NZD/JPY, NZD/CAD, NZD/CHF - Technical Forecast
- New Zealand Dollar has been falling lately. Will losses extend?
- NZD/USD eyeing Falling Wedge, NZD/JPY biased gently lower
- NZD/CAD drop faces next test, NZD/CHF Death Cross ahead?
| Change in | Longs | Shorts | OI |
| Daily | -11% | 1% | -7% |
| Weekly | -18% | 12% | -9% |
NZD/USD Technical Outlook
The New Zealand Dollar seems to be in the process of its next leg lower against the US Dollar within the boundaries of a Falling Wedge chart formation. In early September, NZD/USD tested the ceiling of the wedge but was unable to pierce it. That established a new lower swing high at 0.7170. Recently, prices appeared to bounce off the 0.6881 inflection point, but key resistance points may soon come into play.
Keep a close eye on the 20- and 50-day Simple Moving Averages (SMAs), where a bearish Death Cross may soon form. That would underpin the downside bias. While the Falling Wedge is itself bullish, prices may continue to consolidate with a downward slope within the formation. Falling under the September low may open the door to revisiting the 0.6798 – 0.6756 area. There, NZD/USD may bounce off the floor of the wedge.
NZD/USD Daily Chart
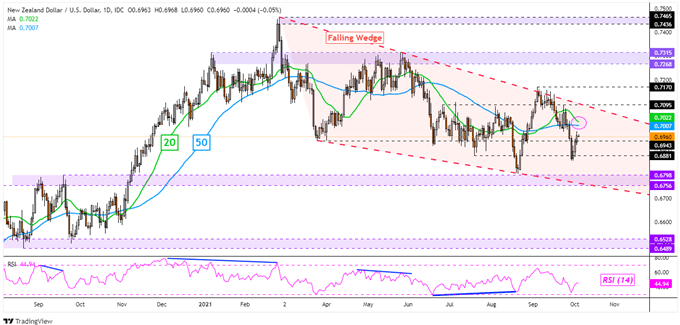
NZD/USD Chart Created in TradingView
NZD/JPY Technical Outlook
The New Zealand Dollar has broadly consolidated against the Japanese Yen since late February, though price action since May has been tilted cautiously lower. A falling trendline appears to be guiding the pair to the downside. Recently, prices have been ranging between that barrier and the 76.666 – 76.225 inflection zone. It seems that for the time being, the 200-day SMA is aiding the dominant upside bias.
Falling under the inflection zone could open the door to retesting the August low at 74.567. Such an outcome would entail passing through the 75.640 inflection point. On the flip side, clearing the trendline may open the door to testing the August high at 78.661. Confirming a breakout above this price could then entail a rise towards the current 2021 high at 80.182.
NZD/JPY Daily Chart
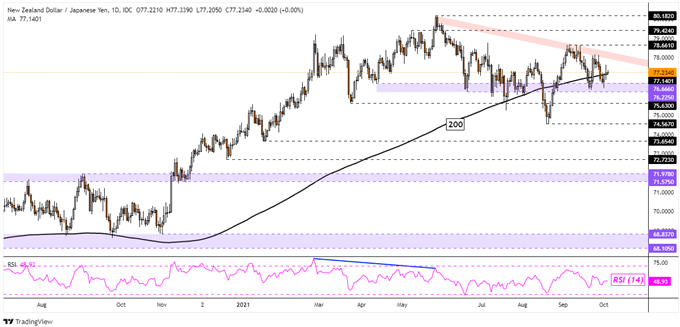
NZD/JPY Chart Created in TradingView

NZD/CAD Technical Outlook
The New Zealand Dollar could be vulnerable to losses against the Canadian Dollar in the near-term. After NZD/CAD turned sharply lower following a test of the 0.9022 – 0.9082 resistance zone and potential falling trendline from February, a bearish Death Cross formed by the 20- and 50-day SMAs could emerge. That would underscore an immediate technical bias to the downside.
Still, the pair has broadly consolidated since the summer of 2020. The 0.8631 – 0.8577 support zone has been holding over this period. Prices are currently testing the 38.2% Fibonacci extension at 0.8763 on the chart below. Taking that out may open the door to retesting the support zone. Otherwise, a turn back above the near-term SMAs could open the door a test of the falling trendline from earlier this year.
NZD/CAD Daily Chart
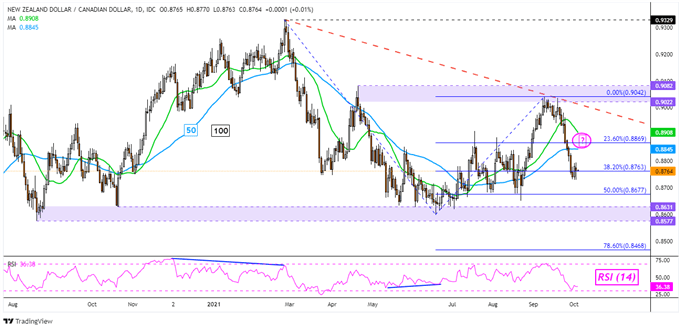
NZD/CAD Chart Created in TradingView
NZD/CHF Technical Outlook
The New Zealand Dollar is also weakening against the Swiss Franc as of late. NZD/USD seems to have been recently rejected at a falling resistance zone from February, pivoting lower towards the 0.6229 – 0.6267 support area. Keep a close eye on the 20- and 50-day SMAs, where a bearish Death Cross could emerge in the coming days. That may precede further losses, placing the focus on the 38.2% Fibonacci extension at 0.6379 and the 50% level at 0.6317.
Breaking under the support zone further exposes the 78.6% Fibonacci extension at 0.6165. On the other side, a near-term rise places the focus on the 0.6582 – 0.6559 resistance zone. Clearing that would expose the April high, which is just under 0.6645. Confirming a breakout above this point may then pave the way for a retest of the current 2021 high at 0.6767.
NZD/CHF Daily Chart
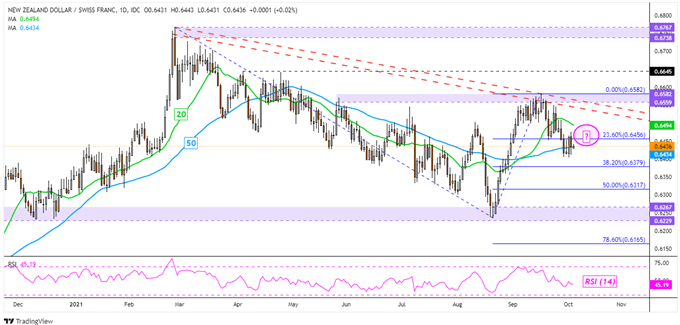
NZD/CHF Chart Created in TradingView
--- Written by Daniel Dubrovsky, Strategist for DailyFX.com
To contact Daniel, use the comments section below or @ddubrovskyFX on Twitter
Trade Smarter - Sign up for the DailyFX Newsletter
Receive timely and compelling market commentary from the DailyFX team


