


US Dollar, USD/SGD, USD/THB, USD/PHP, USD/IDR – ASEAN Technical Analysis
- US Dollar continues to soar against most ASEAN currencies
- USD/SGD eyes 2021 highs, USD/THB nears July 2017 peak
- USD/PHP breaks key triangle, USD/IDR remains restrained

Singapore Dollar Technical Outlook
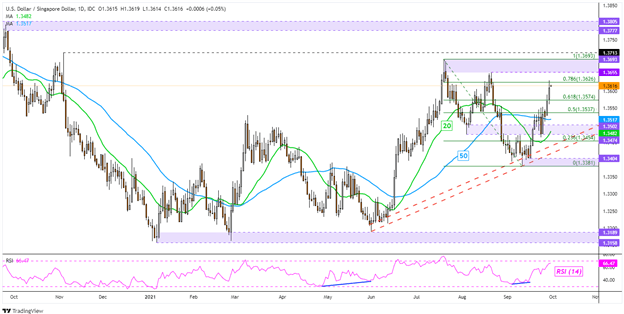
The US Dollar continues to make upside progress against the Singapore Dollar after USD/SGD bounced in early September. This leaves the currency pair facing the next key technical test in order to resume gains since the beginning of this year. That would be the 1.3655 – 1.3693 resistance zone, which contains highs from July and August. Clearing this range exposes the November high at 1.3713. Keep a close eye on the 20- and 50-day Simple Moving Averages (SMAs). A Bullish crossover may occur, underscoring an upside technical bias.
USD/SGD Daily Chart
Thai Baht Technical Outlook
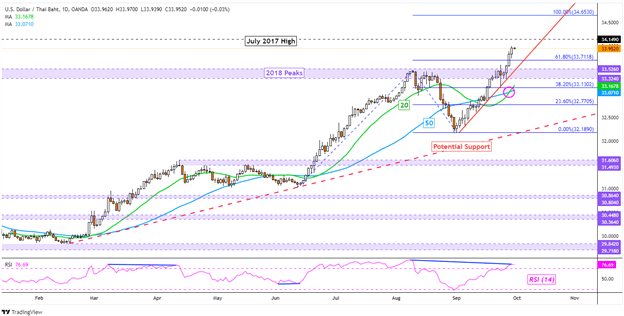
The US Dollar soared against the Thai Baht in recent days, pushing USD/THB to push past highs from 2018. That made for a key zone of resistance between 33.324 and 33.526. Since then, the pair confirmed the breakout, opening the door to extending the uptrend since the end of 2020. Prices are fast approaching the July 2017 high at 34.149. Pushing above this price exposes the 100% Fibonacci extension at 34.653. Guiding prices higher appears to be a near-term rising trendline from late August. Meanwhile, a bullish crossover between the 20- and 50-day SMAs is further underscoring a bullish technical bias.

USD/THB Daily Chart
Philippine Peso Technical Outlook
The US Dollar recently pushed to its highest against the Philippine Peso since April 2020. USD/PHP also confirmed a breakout above a Descending Triangle chart formation. This could hint that gains from June through early July may resume course. Meanwhile, a bullish crossover between the 20- and 50-day SMAs are further underscoring a bullish technical bias. However, a recently formed Bearish Harami candlestick pattern warns to proceed with caution. A near-term turn lower could see the pair test the near-term SMAs. Uptrend resumption exposes the 61.8% Fibonacci extension at 51.98.

USD/PHP Daily Chart
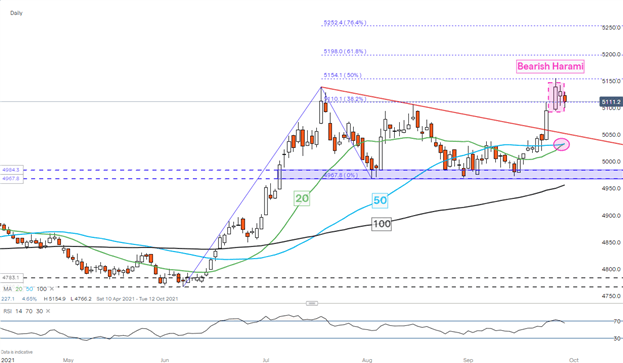
Chart Created on the IG Trading Platform
Indonesian Rupiah Technical Outlook
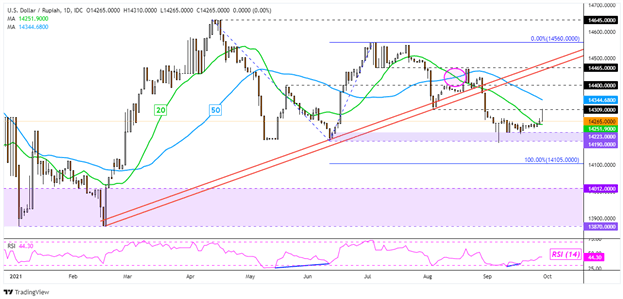
The US Dollar remains fairly restrained against the Indonesian Rupiah. While USD/IDR has not climbed compared to the other ASEAN pairs mentioned in this article, it has also not fallen either. Key support remains as the 14190 – 14223 zone. Prices were unable to hold a push towards the August 4th low at 14309, which seems to be acting as an inflection point. Still, USD/IDR pushed above the 20-day SMA, though unconvincingly. Eyes are on the 50-day line to see if there can be some follow-through. Pushing above the latter may open the door to retesting August peaks. Otherwise, downtrend resumption has the 100% Fibonacci extension in focus at 14105.
USD/IDR Daily Chart
--- Written by Daniel Dubrovsky, Strategist for DailyFX.com
To contact Daniel, use the comments section below or @ddubrovskyFX on Twitter


