


AUD/JPY, AUD/NZD, AUD/CAD - Talking Points
- AUD/JPY and AUD/CAD have overcome some resistance levels, more ahead
- AUD/NZD remains in descending channel, continuing to make new lows
- Overall, the AUD crosses have had big moves lower from May, will they turn around?

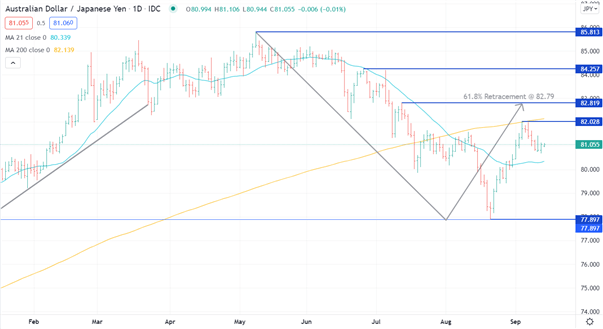
AUD/JPY – Technical Analysis
The AUD/JPY has stalled on its recent rally as it failed to break through the 200-day simple moving average (SMA) at 82.03 last week. That level is now a potential resistance point as it failed again 2 days later to go higher.
Above that level is further possible resistance at the 61.8% Fibonacci retracement level of 82.79, calculated from the May high of 85.81 to the August low at 77.90. This retracement level closely coincides with a previous high at 82.82. Further resistance may lie at the previous highs of 84.26 and 85.81.
Immediate support may be provided at the 21-day SMA of 80.34 and at the previous low of 77.90.
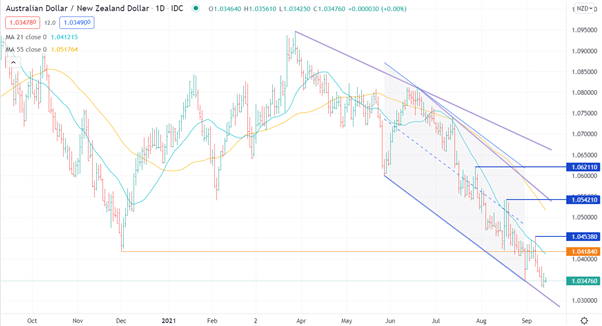
AUD/NZD – Technical Analysis
The AUD/NZD remains in a descending channel and there are several trendlines with a negative gradient. In late August, the cross made a new low for the year when it broke through the previous low of 1.0418.
Trendline support, currently at 1.0310, may lend some potential for a turn higher, and a break below that level could suggest an acceleration in the down move.
On the topside, there are a number of levels that might offer resistance at the previous highs of 1.0454, 1.0542 and 1.0621. Should AUD/NZD move back above the 21-day SMA of 1.0412, it may suggest a pause in the downtrend.

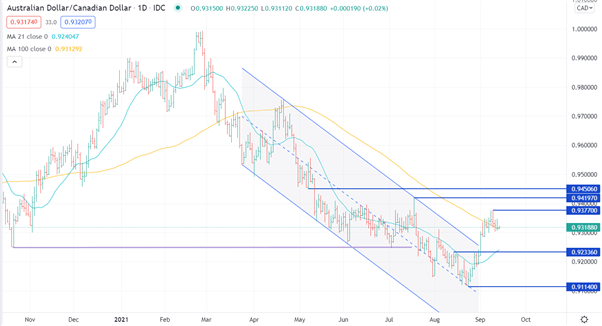
AUD/CAD – Technical Analysis
At the beginning of this month, the AUD/CAD managed to break up through a previous high of 0.9234 and trendline resistance before progressing to move above the 100-day SMA. As a result of this recent run higher, the 21-day SMA has turned to a positive gradient.
The next potential resistance levels are at the recent top of 0.9377 and the previous high at 0.9420. Beyond those points, there is a pivot point reversal at 0.9451 that may offer resistance.
On the downside, 0.9234 has now become a pivot point to watch while the new low of the year at 0.9114 may provide some support.
--- Written by Daniel McCarthy, Strategist for DailyFX.com
To contact Daniel, use the comments section below or @DanMcCathyFX on Twitter


