


EUR/USD, EUR/AUD, EURNZD – Talking Points
- Euro appears to be taking divergent direction across different currency pairs
- The US Dollar is driving markets, including the most-traded EUR/USD
- AUD and NZD have their differences despite tendency to correlate, will this come back into play?

EUR/USD Technical Analysis
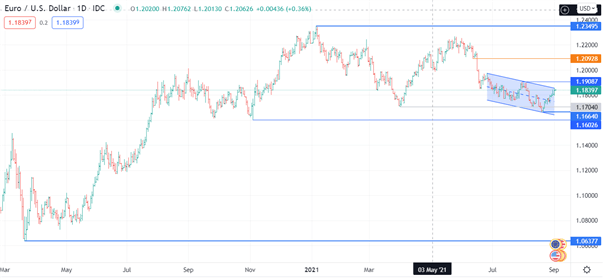
On August 20th, EUR/USD made a new low at 1.1664. This broke down through the support level at 1.1704 which was the previous low at the end of March. Just below 1.1704 at 1.1697 is the 38.2% Fibonacci retracement level from the pandemic low of 1.0640 to the high of 1.2350. The market recently rejected this low (1.1664) and has since climbed to current levels.
EUR/USD is now testing the top of a Descending Channel. The next likely resistance level is the previous high at 1.1909 and further resistance lies at the breakdown pivot point at 1.2093.
On the downside, the first support level may come in at the previous low of 1.1664 before a more significant one at 1.1603, which is the low from early November.
EUR/AUD Technical Analysis
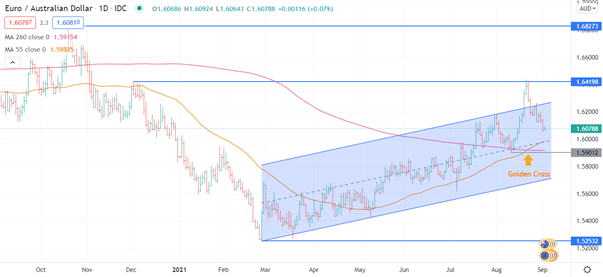
The Euro has been in an Rising Channel against the Australian Dollar since making a low in March at 1.5253. The trend accelerated higher into the end of August and tested the previous high of 1.6420. But, it could not break higher, retreating into the range.
When EUR/AUD marched higher, a golden cross emerged. This is a bullish technical signal where the 55-day simple moving average (SMA) crossed through the 260-day SMA. Resistance is at the previous high of 1.6420 before 1.6827 lies at the high of last October. Support will likely be at the recent low of 1.5901, which is just below the current level of the 269-day moving average at 1.5915.
EUR/NZD Technical Analysis
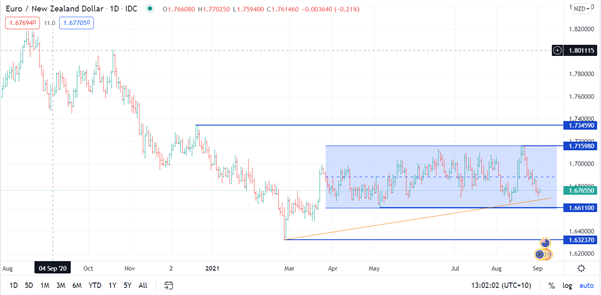
The EUR/NZD cross has been caught in a sideways range since the end of March. A non-directional movement like this likely illustrates a tightening correlation of the underlying currency pairs of EUR/USD and NZD/USD.
There is a rising support line coming in at 1.6680. Larger moves will likely require a breakout of this horizontal channel. Support seems to be at the previous low of 1.6611 and 1.6323. Resistance appears to be at previous highs of 1.7160 followed by 1.7346.
--- Written by Daniel McCarthy, Strategist for DailyFX.com
To contact Daniel, use the comments section below or @DanMcCathyFX on Twitter


