


AUD/USD, AUD/CAD, AUD/NZD, Technical Analysis - Talking Points
- AUD has been weakening against USD, CAD and NZD of late
- A clear downtrend in all 3 crosses holds, but needs more momentum
- Can AUD/NZD hold the range, or will it open up to bigger moves?

AUD/USD Technical Analysis
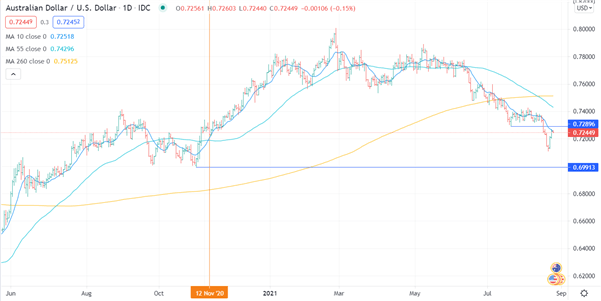
The Triple Moving Average (TMA) is often seen as a powerful momentum signal when it turns on. There are specific conditions required for the TMA to do so and so it does not give a signal very often. I am using 3 simple moving averages on the chart below.
The first condition is order. For a bullish signal, the asset price must be above the short term moving average (MA), which must also be above the medium term MA, which should also be above the long term MA. The second condition is that the gradient of all 3 moving averages must have a positive slope. We saw this bullish signal turn on for AUD/USD on November 12th, 2020.
For a sell signal, the reverse of all these conditions must be met. Currently, AUD/USD has not met these conditions, but is very close. The 200-day moving average gradient is yet to turn negative and the spot price needs to remain below the short term moving average.
In the near term, we have resistance at 0.7290 as it was the break-down level within the downtrend. A break above here may put AUD/USD in a sideways, range trade pattern. Significant support rests at the previous low at 0.6990.

AUD/CAD Technical Analysis
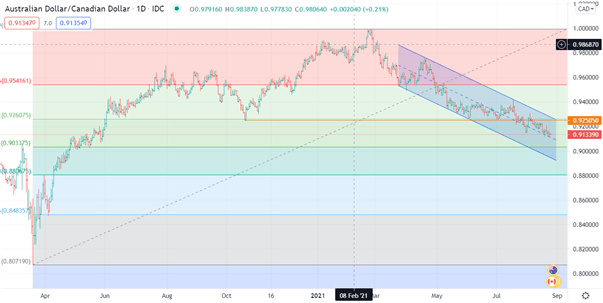
The AUD/CAD is in a channel pointing lower and there is little to stop this downtrend until 0.9033, which is the 50% Fibonacci Retracement of the 0.8071 low and the 0.9995 high. In the near term, resistance is at the previous high of 1.0542. However, the downtrend is likely to remain intact until the channel is broken and the resistance level at 1.0620 is overcome.
AUD/NZD Technical Analysis
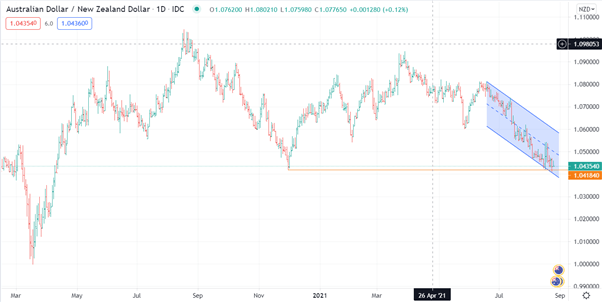
The AUD/NZD, sometimes referred to as the “Antipodean Cross”, is also in a downtrend. AUD/NZD has traded below the December low of 1.0818, but most technicians would not regard this as a break because it has not closed below that level. A confirmed break below that price may open up moves lower. However, AUD/NZD is renowned for range trading and this should be incorporated into risk management.
--- Written by Daniel McCarthy, Strategist for DailyFX.com
To contact Daniel, use the comments section below or @DanMcCathyFX on Twitter


