


US Dollar, USD/SGD, USD/THB, USD/PHP, USD/IDR – ASEAN Technical Analysis
- The US Dollar losing momentum against ASEAN currencies, new top?
- USD/SGD may be vulnerable to near-term losses, USD/THB stalling?
- USD/PHP consolidating under key resistance, USD/IDR eyes trendline
Singapore Dollar Technical Outlook
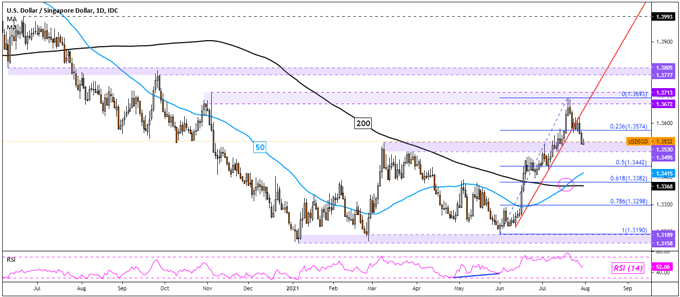
The Singapore Dollar is attempting to regain lost ground against the US Dollar, but the broader USD/SGD outlook still remains tilted to the upside. There may be room for losses in the near term after the pair confirmed a breakout under rising support from June. Now, prices are retesting the 1.3530 – 1.3495 inflection zone. A bullish ‘Golden Cross’ between the 50- and 200-day Simple Moving Averages (SMAs) underpins a bullish bias in the medium-term. These lines may reinstate the focus higher should prices turn materially lower.
USD/SGD Daily Chart
Thai Baht Technical Outlook
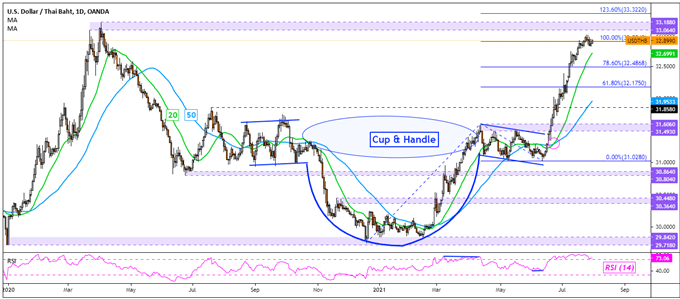
The US Dollar has also slowed its advance against the Thai Baht, but USD/THB remains relatively elevated. It sits around the highest since April 2020, with key resistance sitting above between 33.188 and 33.064. Keep a close eye on RSI, negative divergence may emerge. That would be a sign of fading upside momentum which can at times precede a turn lower. This is where the 20-day SMA may come into play as key support. If it breaks, that would subsequently expose the 50-day SMA in the event of a material downturn.

USD/THB Daily Chart
Philippine Peso Technical Outlook
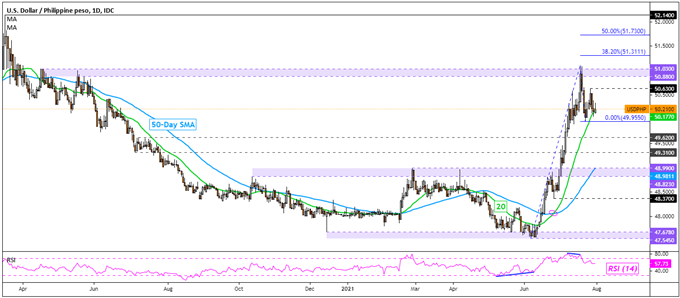
The Philippine Peso is also stabilizing against the US Dollar, but volatility still remains a threat given recent choppy price action. USD/PHP struggled to breach the key 50.88 – 51.03 resistance zone following negative RSI divergence. Now, the 20-day SMA is in focus as immediate support. A bounce could place the focus on immediate resistance at 50.63. Otherwise, dropping through 49.95 exposes the 50-day SMA which may reinstate the dominant focus to the upside.

USD/PHP Daily Chart
Indonesian Rupiah Technical Outlook
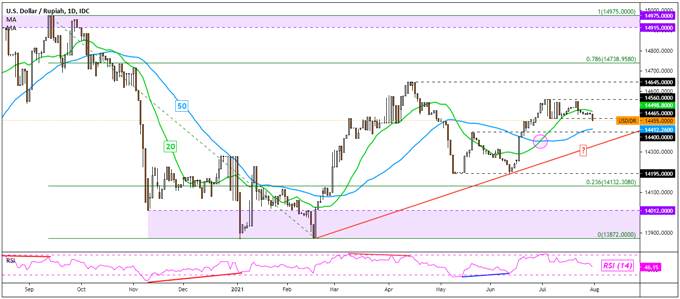
The Indonesian Rupiah may see some near-term progress against the US Dollar as USD/IDR attempts to breach key support at 14465. Confirming the breakout would place the focus on the 50-day SMA. A ‘Golden Cross’ emerged in June between the 20- and 50-period lines, offering an upside bias. A potential trendline from February could also come into play in the event of deeper losses. Resuming this year’s bottom entails clearing 14560 towards the April high at 14645.
USD/IDR Daily Chart
--- Written by Daniel Dubrovsky, Strategist for DailyFX.com
To contact Daniel, use the comments section below or @ddubrovskyFX on Twitter


