


S&P 500, Dow Jones, Technical Analysis, Retail Trader Positioning - Talking Points
- Retail investors have greatly increased downside exposure in US stock indices
- But, recent shifts in S&P 500 and Dow Jones sentiment offering mixed outlook
- Eyes are on the Fed and US Core PCE data this week, webinar recording above

Retail investors are once again back to their natural tendency of shorting US benchmark stock indices, as reported by IG Client Sentiment (IGCS). IGCS is typically a contrarian indicator, meaning that if traders continue selling recent trends in the S&P 500 and Dow Jones, the outlook could turn increasingly bullish. For a detailed analysis about this and how you can use IGCS, check out the recording of my webinar above.
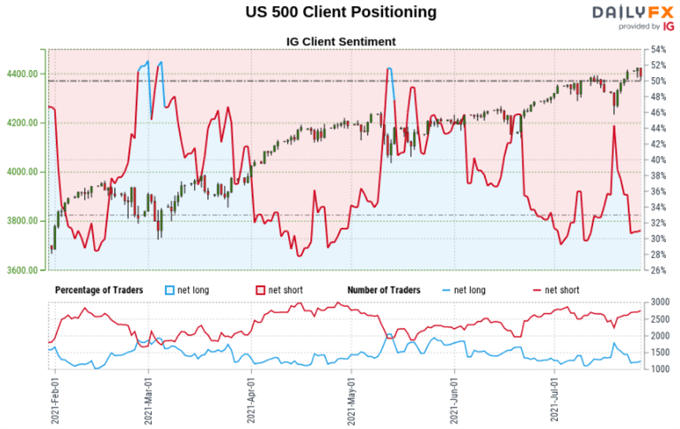
S&P 500 Sentiment Outlook - Mixed
The IGCS gauge implies that 35% of retail traders are net-long the S&P 500. Upside exposure increased by 3.74% while decreasing by 19.80% over a daily and weekly basis respectively. We typically take a contrarian view to crowd sentiment, so the fact that investors are net-short hints that prices may keep rising. However, recent shifts in sentiment offers a mixed S&P 500 trading bias.

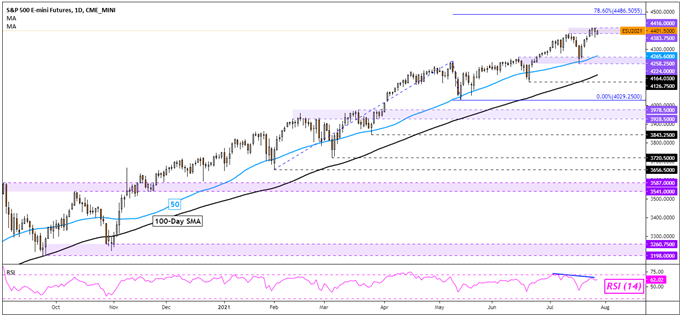
Technical Analysis
S&P 500 futures are testing the key 4416 – 4383 resistance zone as the index remains committed to a dominant uptrend since last year’s bottom. Negative RSI divergence does warn that upside momentum is fading, which can at times precede a turn lower. Such an outcome may place the focus on the 50- and 100-day Simple Moving Averages (SMAs). These could reinstate an upside focus as key support points. Clearing resistance exposes the 78.6% Fibonacci extension at 4486.
S&P 500 Futures Daily Chart
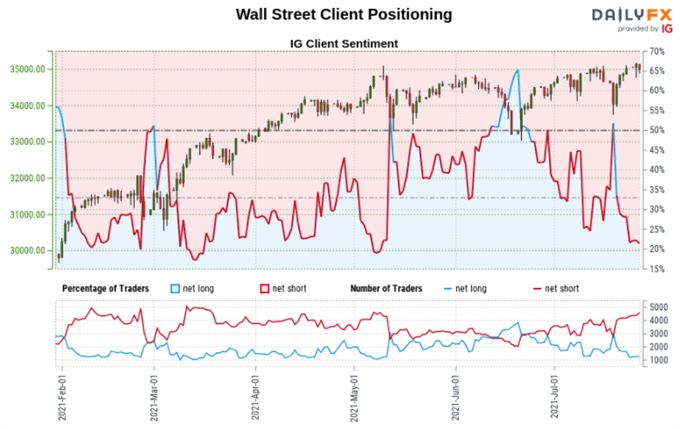
Dow Jones Sentiment Outlook - Mixed
The IGCS gauge implies that about 28% of retail traders are net-long the Dow Jones. Downside exposure decreased by 10.93% while increasing 3.0% over a daily and weekly basis respectively. We typically take a contrarian view to crowd sentiment. With most traders being net-short, the Dow may continue rising. However, recent shifts in sentiment offer a mixed trading bias.

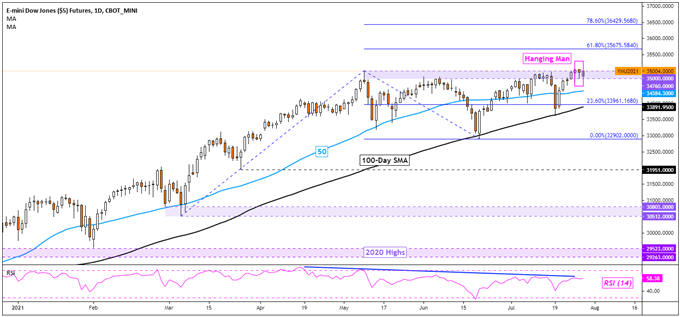
Technical Analysis
Dow Jones futures have left behind a bearish Hanging Man candlestick pattern on the daily chart. Given downside follow-through, this could precede a turn lower amid negative RSI divergence. This is as prices are once again testing the 35000 – 34760 resistance zone. A drop would likely place the focus on the 50- and 100-day SMAs which may reinstate the dominant upside focus. Resuming the dominant uptrend exposes the 61.8% Fibonacci extension at 35675.
Dow Jones Futures Daily Chart
*IG Client Sentiment Charts and Positioning Data Used from July 28th Report
--- Written by Daniel Dubrovsky, Strategist for DailyFX.com
To contact Daniel, use the comments section below or @ddubrovskyFX on Twitter


