


BTC & ETH Technical Highlights:
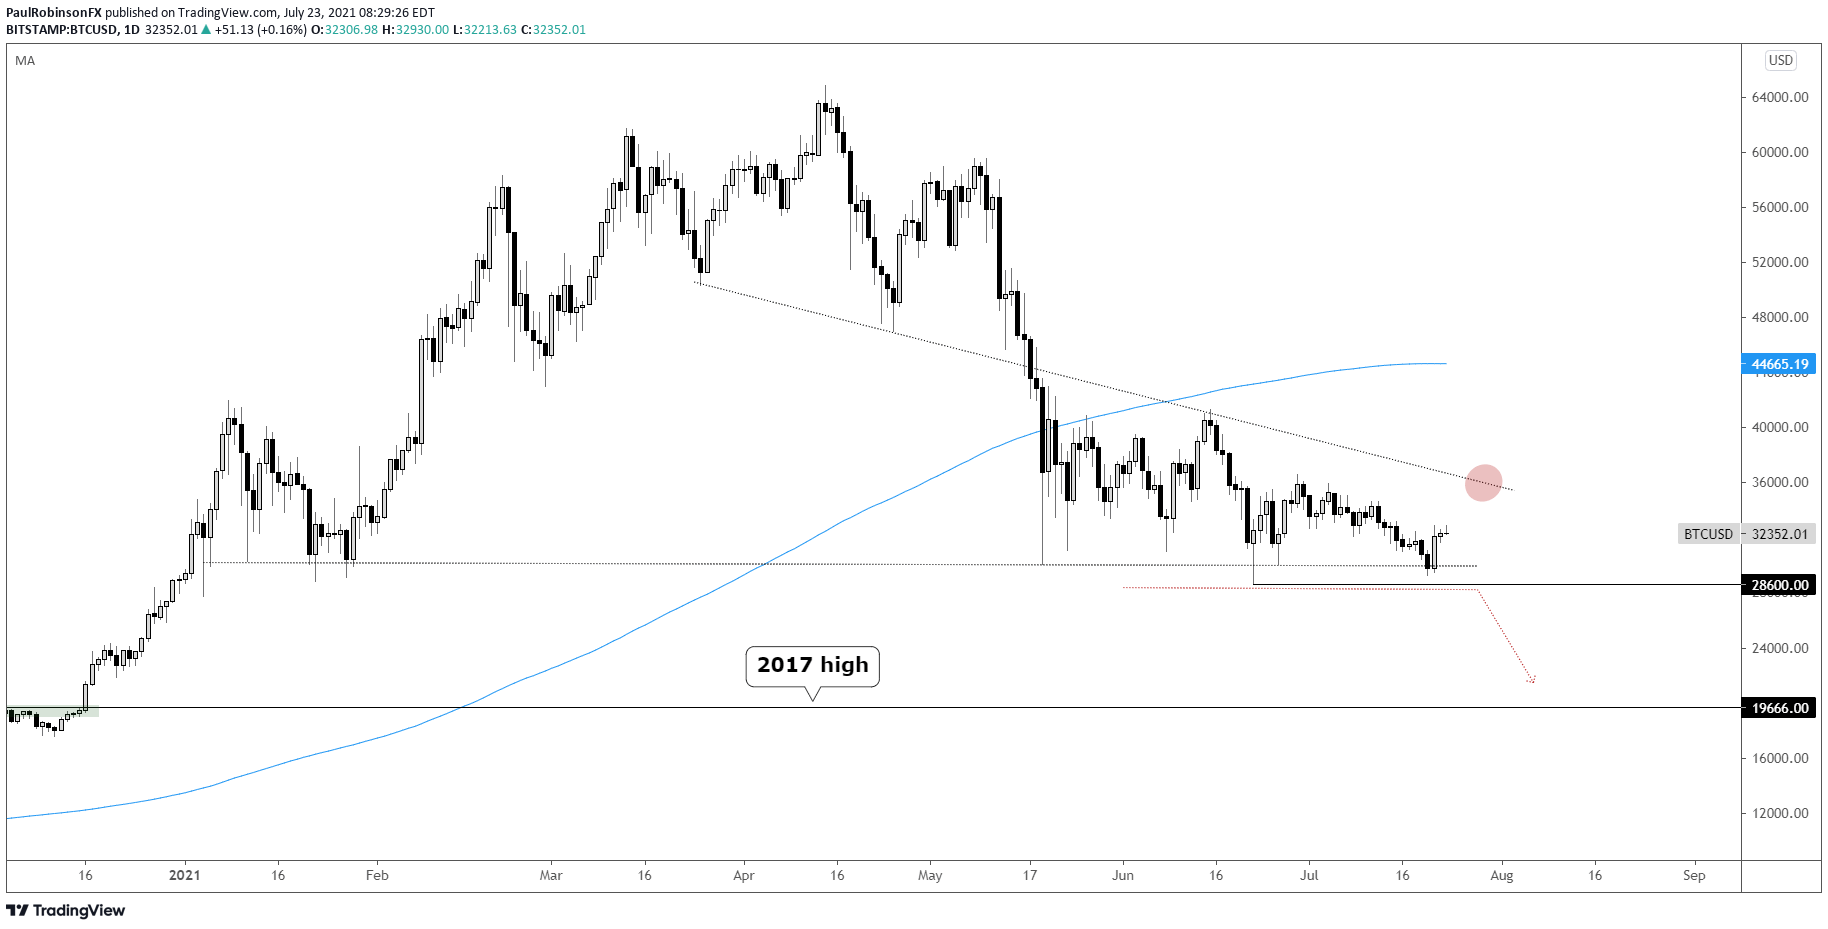
- BTC/USD treading water sideways, 28600 the big level to watch
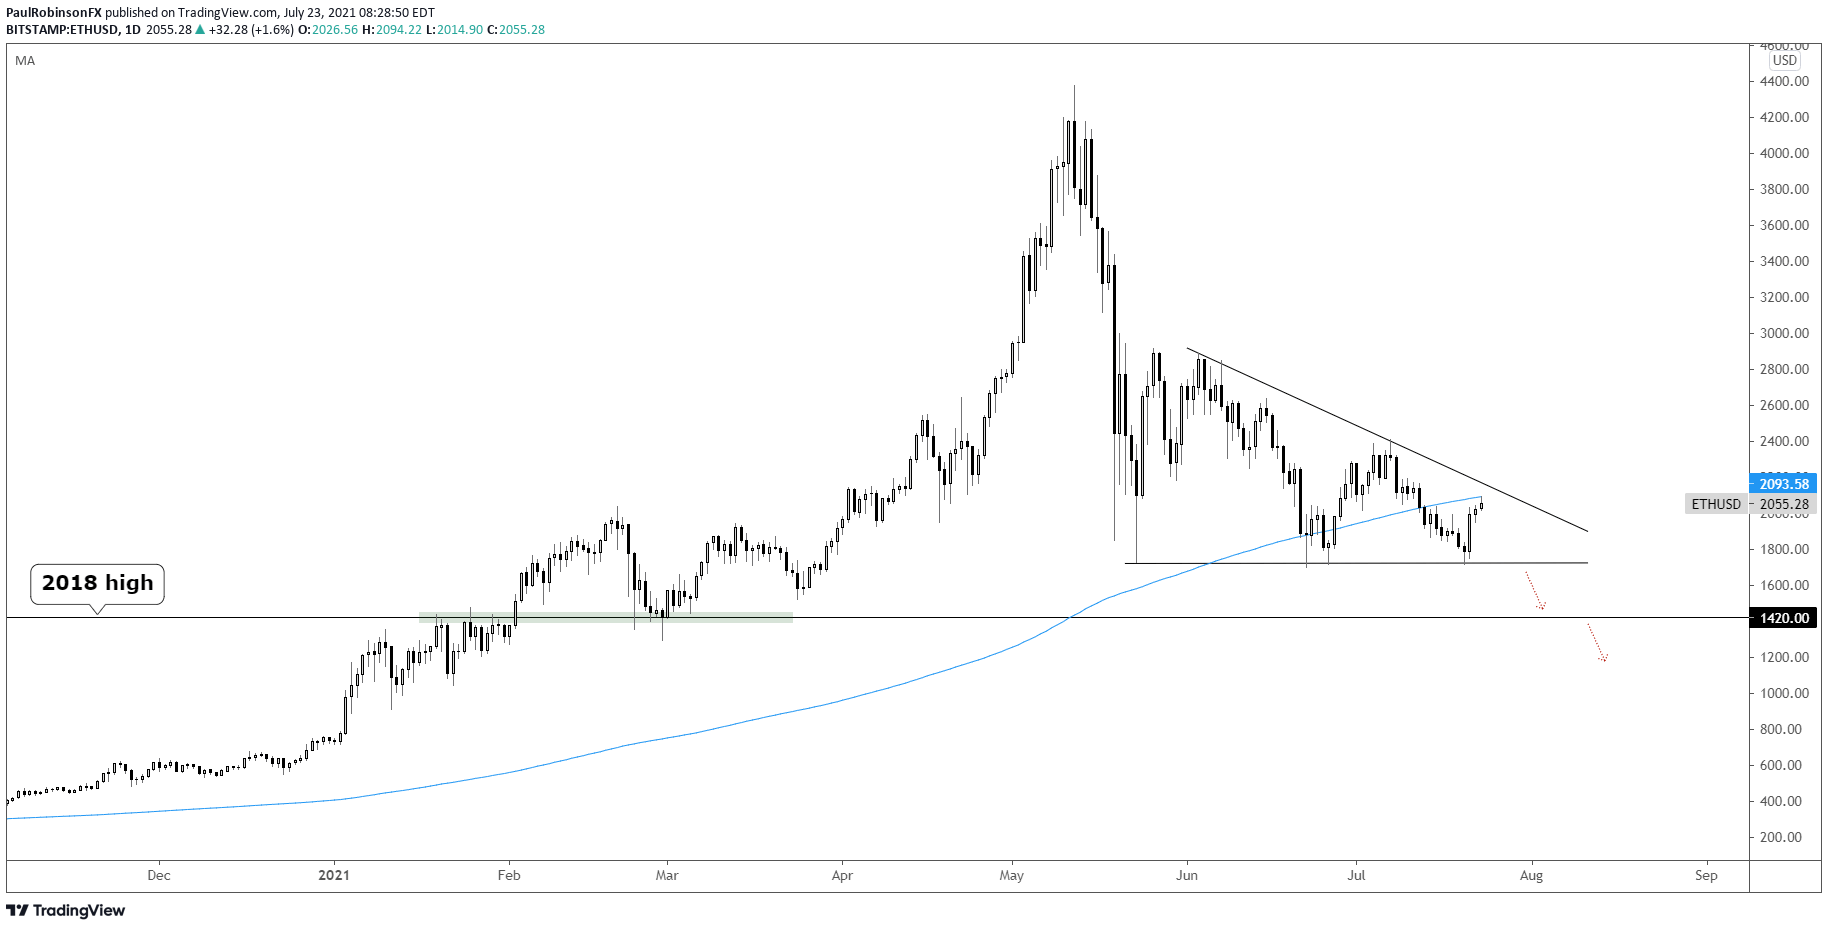
- ETH/USD working on forming a nice-looking descending wedge
BTC/USD continues to meander sideways, with more downside expected. It could still rally a bit from here up to around 36k or so and still have a bearish look to it. In fact, if it does that could make for a solid wedge formation. In any event, a break below 28600 is seen as triggering another sell-off to at least the 2017 high at 19666.
ETH/USD is forming a nice-looking descending wedge that is poised to send it lower. The pattern could of course trigger to the upside by breaking the top-side trend-line of the pattern, but is seen as the less likely outcome. A breakdown below 1700 will have 1420 and lower in focus. The size of the wedge implies we could see a measured move down to around 700.
For the full details, check out the video above.

BTC/USD Daily Chart
ETH/USD Daily Chart
Resources for Forex Traders
Whether you are a new or experienced trader, we have several resources available to help you; indicator for tracking trader sentiment, quarterly trading forecasts, analytical and educational webinars held daily, trading guides to help you improve trading performance, and one specifically for those who are new to forex.
---Written by Paul Robinson, Market Analyst
You can follow Paul on Twitter at @PaulRobinsonFX


