


US Dollar, USD/SGD, USD/THB, USD/PHP, USD/IDR – ASEAN Technical Analysis
- The US Dollar is pushing for an aggressive comeback against ASEAN currencies
- USD/SGD may be on the verge of breaking a Rectangle, USD/THB eyeing 2020 peaks?
- USD/PHP shot higher, clearing key resistance points. USD/IDR relatively tame for now

Singapore Dollar Technical Outlook
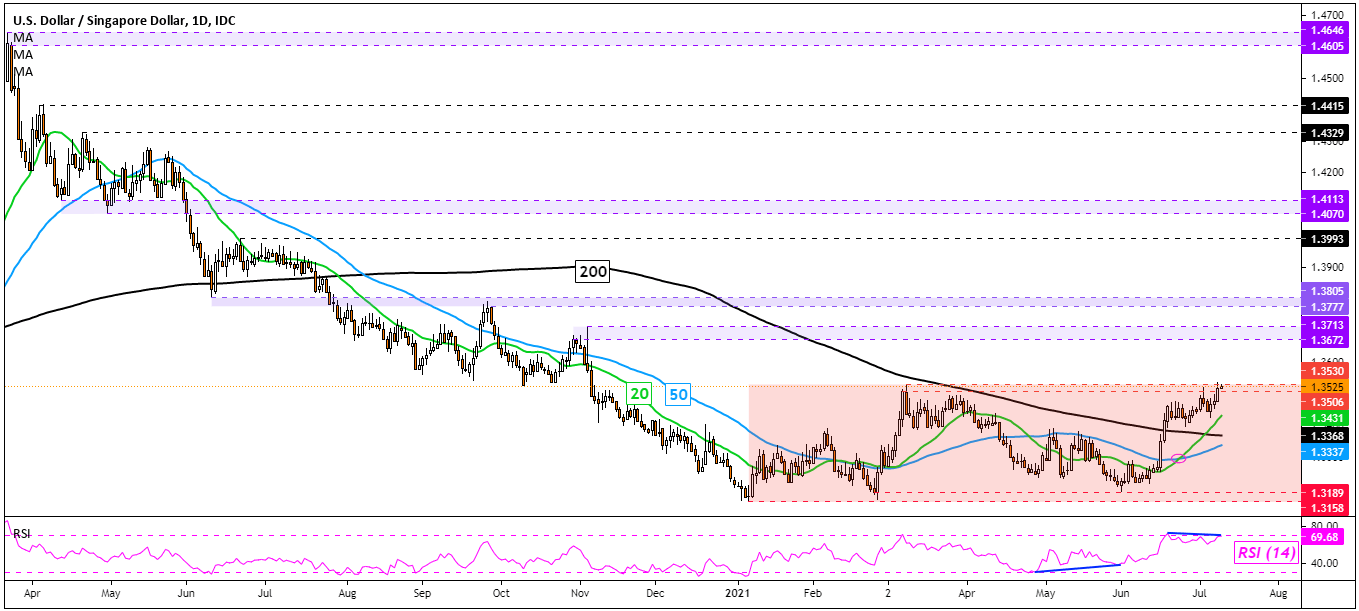
The US Dollar may be on the verge of extending gains against the Singapore Dollar after USD/SGD closed at its highest since November. Prices are eyeing the ceiling of a Rectangle Chart formation, with resistance as the 1.3530 – 1.3506 zone. This also follows a bullish crossover between the 20-day and 50-day Simple Moving Averages (SMAs). Still, negative RSI divergence is persisting. That shows upside momentum is fading, which can precede a turn lower. If that occurs, the floor of the rectangle could be targeted as consolidation resumes. Otherwise, prices may aim for their highest since early November.
USD/SGD Daily Chart
Thai Baht Technical Outlook
The US Dollar extended gains against the Thai Baht quite aggressively over the past month. This followed the bullish implications of a Cup and Handle chart pattern noted earlier in June. USD/THB is now trading at its highest since April 2020, pushing upward in the aftermath of a bullish crossover between the 20- and 50-day SMAs. Prices closed above the 78.6% Fibonacci extension at 32.4928. That has exposed peaks from 2020, creating a zone of resistance between 33.0640 and 33.1880 when prices topped in the aftermath of the global coronavirus outbreak.

USD/THB Daily Chart

Philippine Peso Technical Outlook
The US Dollar also extended aggressive gains against the Philippine Peso over the past month. This has brought USD/PHP to its highest since June 2020 in the aftermath of breaking above a Rectangle chart pattern. Immediate resistance seems to be the June 12th, 2020 high at 51.415. Clearing this price would subsequently expose the 50.88 – 51.03 resistance zone. Otherwise, a turn lower may place the focus on rising support from last month, as well as the 20- and 50-day SMAs.

USD/PHP Daily Chart

Indonesian Rupiah Technical Outlook
The US Dollar is also attempting to extend gains against the Indonesian Rupiah since June, but USD/IDR’s upside progress has been relatively mute recently. USD/IDR paused gains on the 14525 – 14563 inflection zone. Still, a bullish crossover between the 20- and 50-day SMAs hint that the near-term bias may be tilted upward. Breaching the inflection zone exposes peaks from April. Otherwise, a turn lower and drop through the near-term SMAs may place the focus on a potential rising trendline from February.
USD/IDR Daily Chart

--- Written by Daniel Dubrovsky, Strategist for DailyFX.com
To contact Daniel, use the comments section below or @ddubrovskyFX on Twitter


