


New Zealand Dollar, NZD/USD, NZD/JPY, NZD/CAD - Technical Forecast
- New Zealand Dollar may be readying to extend losses
- NZD/USD is eying a bearish crossover, February top
- NZD/JPY, NZD/CAD are facing wedge chart patterns
New Zealand Dollar Technical Outlook
The New Zealand Dollar may be readying to extend losses against the US Dollar after a potential ‘Dead Cat Bounce’. NZD/USD reinforced support around the 0.6923 – 0.6943 zone last week before climbing to 0.7095. A bearish crossover between the 20-day and 50-day Simple Moving Averages (SMAs) warn that the near-term bias may favor the downside. Extending February’s top does entail taking out the highlighted support zone. That would expose the 0.6798 – 0.6756 inflection zone thereafter.
| Change in | Longs | Shorts | OI |
| Daily | 6% | -13% | 2% |
| Weekly | 40% | -35% | 15% |
NZD/USD Daily Chart
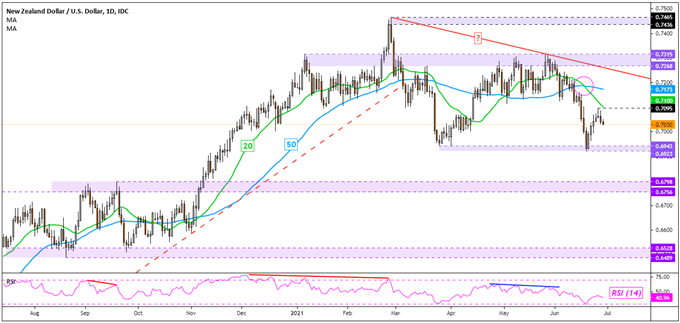
NZD/USD Chart Created in TradingView
The New Zealand Dollar is also looking vulnerable against the Japanese Yen. NZD/JPY may be attempting to resume May’s top after breaking under a bearish Rising Wedge chart pattern. Now, a bearish crossover between the 20-day and 50-day SMAs are offering further arguments to the downside. That would likely place the focus on the 76.225 – 76.666 support zone before facing the March low at 75.63. Otherwise, a push above the SMAs may open the door to revisiting the May high at 80.182.
NZD/JPY Daily Chart
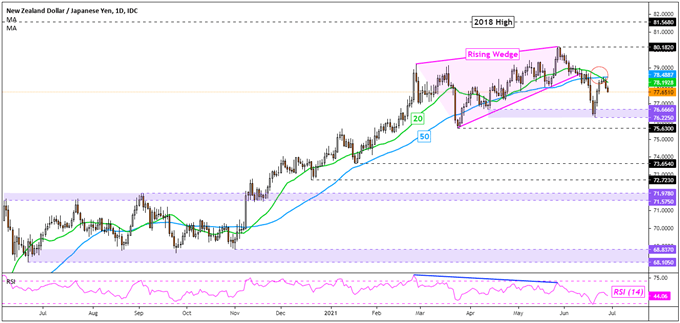
NZD/JPY Chart Created in TradingView
The New Zealand Dollar may continue to consolidate in a downward direction against the Japanese Yen. That is because NZD/CAD appears to be trading within the confines of a bullish Falling Wedge chart pattern. Prices could bounce again off the 0.8577 – 0.8631 support zone, climbing to the ceiling of the wedge. This is as positive RSI divergence shows that downside momentum is fading, which can at times precede a turn higher. Otherwise, breaking lower exposes the 61.8% Fibonacci retracement at 0.8519.

NZD/CAD Daily Chart
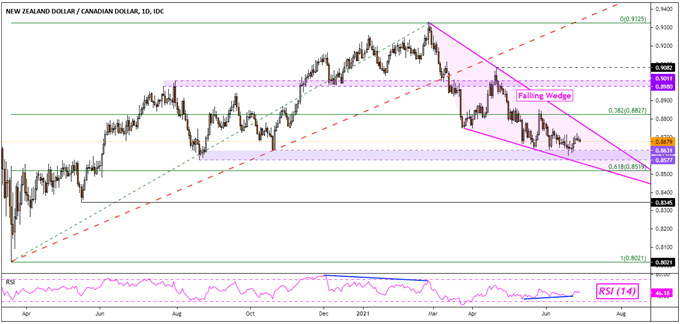
NZD/CAD Chart Created in TradingView
--- Written by Daniel Dubrovsky, Strategist for DailyFX.com
To contact Daniel, use the comments section below or @ddubrovskyFX on Twitter


