


US Dollar, USD/SGD, USD/THB, USD/PHP, USD/IDR – ASEAN Technical Analysis
- US Dollar is seeing mixed technical signals across ASEAN FX
- USD/SGD remains range-bound, USD/THB eyeing Cup & Handle
- USD/IDR bounce may run out of steam, will USD/PHP bottom?

Singapore Dollar Technical Outlook
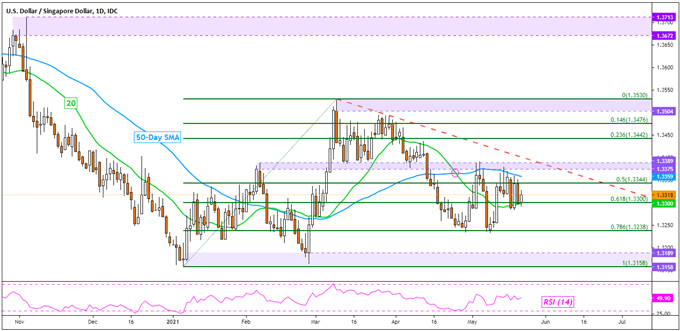
The US Dollar continues to consolidate against the Singapore Dollar, but with what seems to be a slight downside bias. There was a bearish crossover between the 20- and 50-period Simple Moving Averages in April that remains in play. Falling resistance from March also seems to be maintaining the downside bias. A daily close under the 78.6% Fibonacci retracement at 1.3238 may open the door to revisiting the key 1.3158 – 1.3189 support zone.
USD/SGD Daily Chart
Thai Baht Technical Outlook
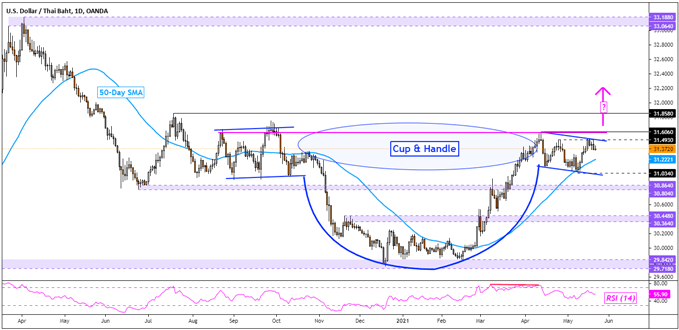
USD/THB seems to be brewing a Cup and Handle chart pattern. A push above the handle on the right could open the door to extending February’s bottom, placing the focus on the July high at 31.858 – see chart below. The 50-day SMA also seems to be maintaining the near-term focus to the upside. Still, prices may continue oscillating within the handle in a steady downtrend. More aggressive losses could open the door to revisiting the 30.804 – 30.864 inflection zone.

USD/THB Daily Chart
Indonesian Rupiah Technical Outlook
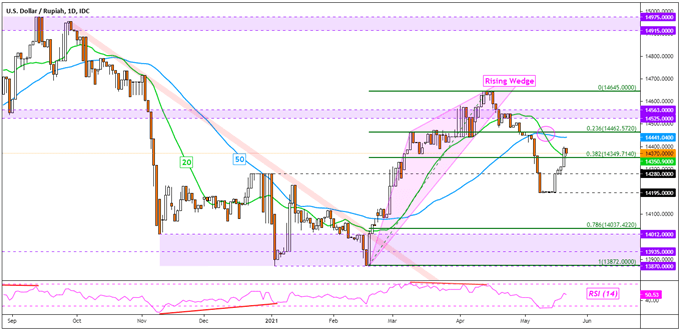
USD/IDR remains in a near-term downtrend despite establishing support at 14195 and bouncing off it. The pair may continue to the downside given the bearish implications of a Rising Wedge breakout and ‘Death Cross’ between the 20-day and 50-day SMAs. Resuming the downtrend may open the door to revisiting February lows. Otherwise, pushing above the 50-day SMA exposes the 23.6% Fibonacci retracement at 14462. Beyond the latter sits the April peak.
For updates on ASEAN currencies as they break key technical levels, be sure to follow me on Twitter @ddubrovskyFX.
USD/IDR Daily Chart
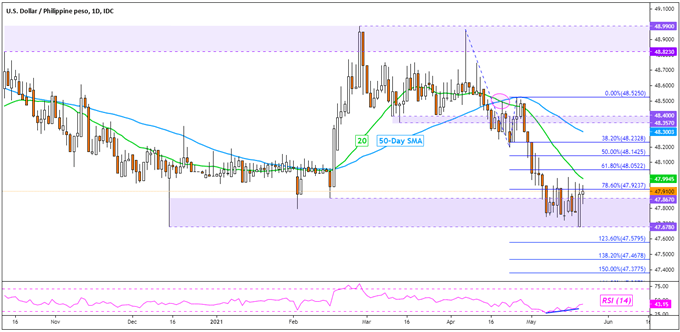
Philippine Peso Technical Outlook
USD/PHP could be readying to turn higher and bounce off the 47.678 – 47.867 support zone. Positive RSI divergence continues to show that downside momentum is fading which can at times precede a turn higher. Such an outcome would likely place the focus on the 20-day SMA as immediate resistance. If the line fails to maintain the downside bias, that would subsequently expose the 50-day SMA. Otherwise, downtrend resumption exposes the 123.6% Fibonacci extension at 47.5795.

USD/PHP Daily Chart
--- Written by Daniel Dubrovsky, Strategist for DailyFX.com
To contact Daniel, use the comments section below or @ddubrovskyFX on Twitter


