


US Dollar, USD/SGD, USD/PHP, USD/THB, USD/IDR – ASEAN Technical Analysis
- US Dollar continues to consolidate against most ASEAN FX
- USD/SGD still eyeing 200-day SMA, USD/PHP faces triangle
- USD/THB may extend gains, USD/IDR losing upside momentum

Singapore Dollar Technical Outlook
The Singapore Dollar continues to consolidate against the US Dollar as USD/SGD struggles to confirm a push above a falling zone of resistance from June. Prices are oscillating between the 1.3504 – 1.3527 inflection zone and the 1.3389 inflection point. The 200-day Simple Moving Average (SMA) is now just above current price action for a key point of resistance and it may reinstate the dominant downside focus. Otherwise, a push higher may pave the way to revisit peaks from October.
USD/SGD Daily Chart

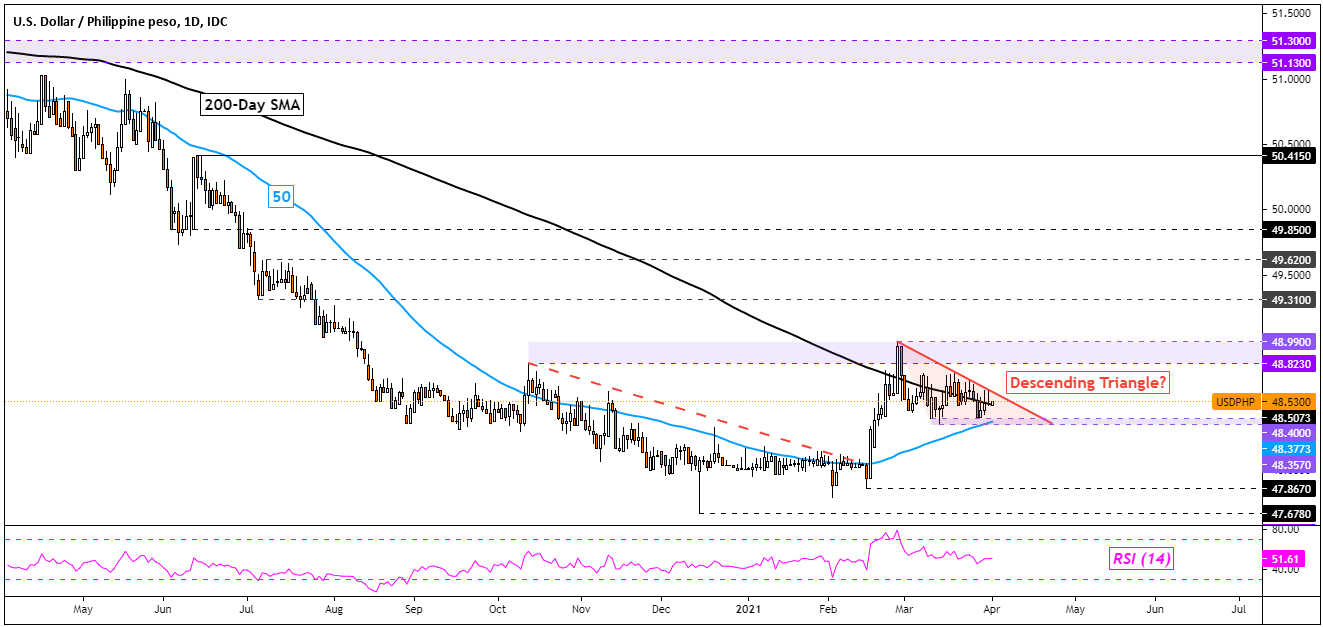
Philippine Peso Technical Outlook
The Philippine Peso appears to be trading within a Descending Triangle against the US Dollar. The direction of the breakout could be key for preceding the next key move in USD/PHP. For the time being, the 200-day SMA seems to be maintaining the dominant downside focus. But, below the 50-day SMA is fast approaching from below which could maintain the near-term upside bias. A break below it could open the door to revisiting February lows. Otherwise, pushing above the 48.82 – 48.99 resistance zone exposes the 49.31 inflection point.

USD/PHP Daily Chart
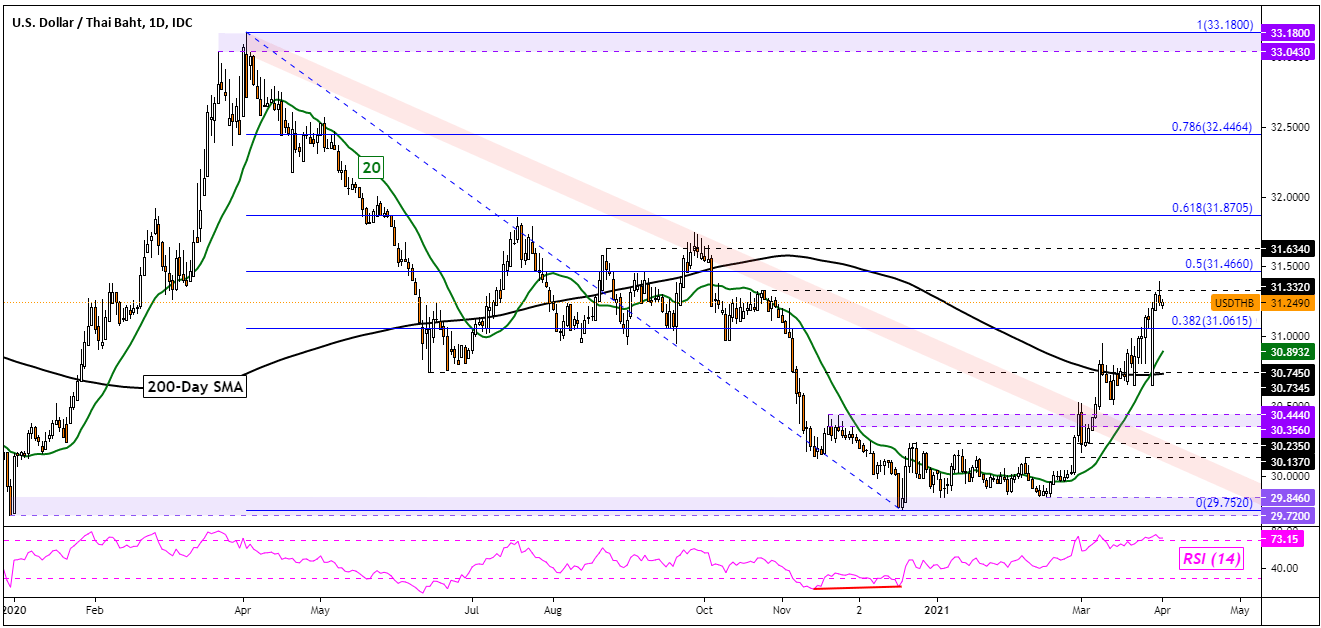
Thai Baht Technical Outlook
The US Dollar continues its aggressive upward push against the Thai Baht, particularly after USD/THB managed to confirm a breakout above the 200-day SMA. There has since been a bullish crossover between that and the near-term 20-day SMA, opening the door to further upside potential. Prices are facing the October 23rd high at 31.332, where a push above exposes the midpoint of the Fibonacci retracement at 31.466. Beyond that sits peaks from August and September of last year.

USD/THB Daily Chart
Indonesian Rupiah Technical Outlook
The US Dollar continues to struggle at making further progress against the Indonesian Rupiah as USD/IDR consolidates above the 200-day SMA. Immediately above is the key 14525 – 14563 inflection zone, where a push higher exposes highs from September 2020. Negative RSI divergence does show that upside momentum is fading, That can precede a turn lower. In such an outcome, keep an eye on the near-term 20-day SMA as key support. It looks poised to cross above the 200-day SMA.
For updates on ASEAN currencies as they break key technical levels, be sure to follow me on Twitter @ddubrovskyFX.
USD/IDR Daily Chart

--- Written by Daniel Dubrovsky, Strategist for DailyFX.com
To contact Daniel, use the comments section below or @ddubrovskyFX on Twitter
https://www.tradingview.com/symbols/USDIDR/?exchange=FX_IDC


