


US Dollar, USD/SGD, USD/IDR, USD/PHP, USD/IDR – ASEAN Technical Analysis
- USD/SGD eyeing 100-day SMA as it trades within a Bearish Rectangle
- USD/IDR may extend gains following a push above the 100-day SMA
- USD/PHP idling around 200-day SMA? USD/THB downtrend in focus

Singapore Dollar Technical Outlook
The Singapore Dollar continues to trade within a brewing ‘Bearish Rectangle’ chart pattern against the US Dollar. The 100-day Simple Moving Average (SMA) is also coming into focus, acting as resistance. That may pressure USD/SGD lower within the confines of the rectangle for another chance at taking out support which is a range between 1.3158 – 1.3215. Taking this zone out exposes lows from 2018. The ceiling of the rectangle seems to be a range between 1.3375 – 1.3404. Above it is falling resistance from June – see chart below.
USD/SGD Daily Chart
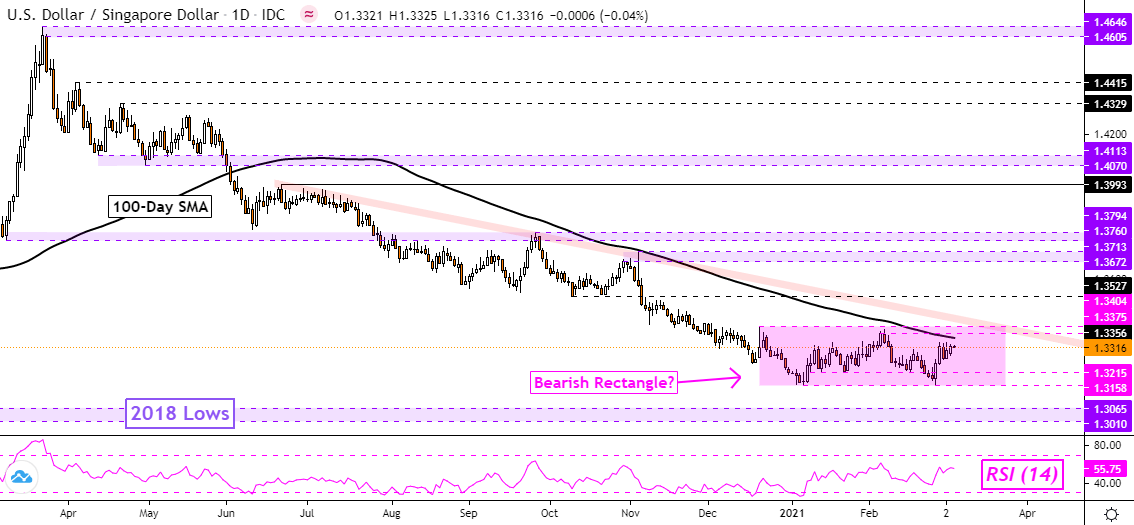
USD/SGD Chart Created in TradingView
Indonesian Rupiah Technical Outlook
The Indonesian Rupiah is at risk to the US Dollar. USD/IDR has extended gains above key falling resistance from September, now taking out the 100-day SMA and resistance at 14280. That has exposed the 14525 – 14563 inflection zone. Prices may target this area next where there may then be a chance of a turn lower. Otherwise, pushing above this zone would expose peaks from September. A drop through the SMA would likely place the focus on key support between 13870 and 14012.
For updates on ASEAN currencies as they break key technical levels, be sure to follow me on Twitter @ddubrovskyFX.
USD/IDR Daily Chart
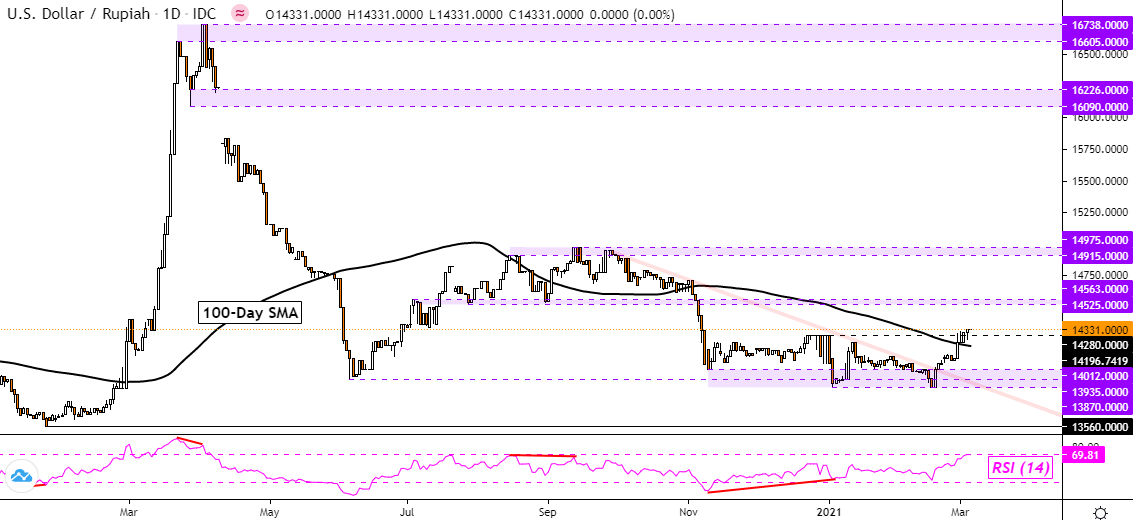
USD/IDR Chart Created in TradingView
Philippine Peso Technical Outlook
Things are looking more neutral for the Philippine Peso. USD/PHP has been unable to hold a push above the 200-day SMA as it played out as key resistance. The pair left behind a new zone of resistance, between 48.8230 and 48.9900. Prices are sitting just above the 48.2870 – 48.3600 inflection zone, where a bounce may place the focus on February highs. Otherwise, a drop through the inflection range would expose lows from earlier this year.

USD/PHP Daily Chart
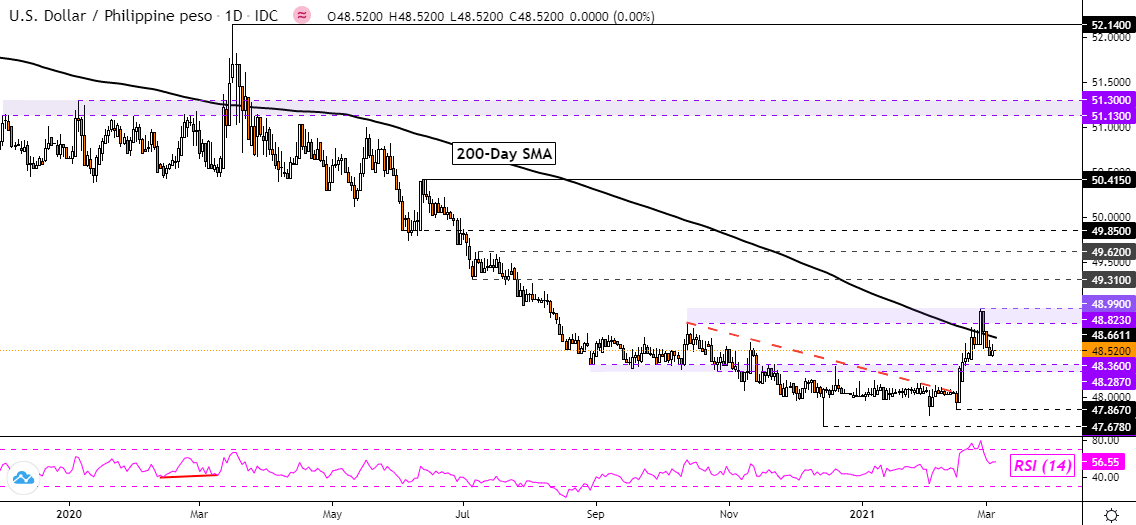
USD/PHP Chart Created in TradingView
Thai Baht Technical Outlook
The Thai Baht has recently been under pressure against the US Dollar, especially after USD/THB broke above a Descending Triangle chart pattern. But, long-term falling resistance from April 2020 seems to be maintaining the dominant focus to the downside. The 30.3560 – 30.4440 resistance zone is also playing a key role. A push above these points would expose the 200-day SMA for a chance to turn lower. Resuming the dominant downtrend entails a drop through the 29.7520 – 29.8460 support zone, which is also the floor of the triangle.

USD/THB Daily Chart
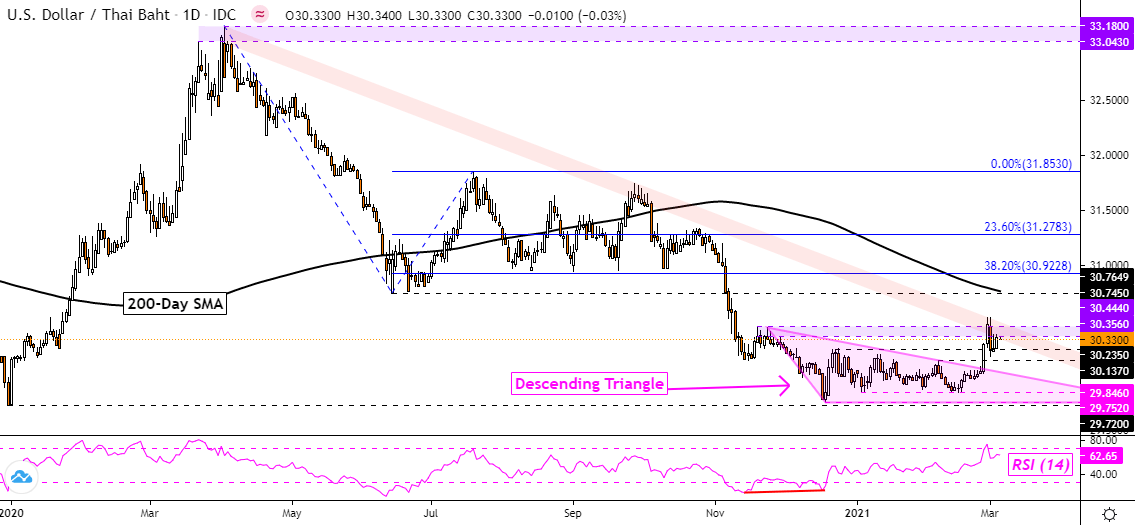
USD/THB Chart Created in TradingView
--- Written by Daniel Dubrovsky, Strategist for DailyFX.com
To contact Daniel, use the comments section below or @ddubrovskyFX on Twitter


