


DAX 30, FTSE 100, S&P 500, Technical Analysis, Retail Trader Positioning - Talking Points
- European and US equities are pushing higher, but is a turn lower ahead?
- Retail trader positioning hinting that DAX 30 and S&P 500 may decline
- FTSE 100 in a consolidative state as upside exposure seems to be fading

This week, I covered the outlook for equities such as the DAX 30, FTSE 100 and S&P 500 using IG Client Sentiment (IGCS). The tool is typically a contrarian indicator. For a more in-depth analysis of where these assets may go, including coverage of fundamentals, check out the recording of the webinar above.
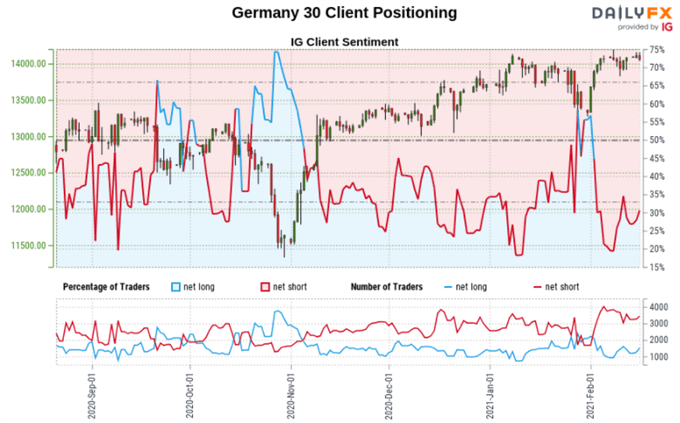
DAX 30 Sentiment Outlook - Bearish
The IGCS gauge implies that roughly 33% of retail traders are net long the DAX 30. Upside exposure has climbed by 0.30% and 8.46% over a daily and weekly basis respectively. Recent changes in sentiment warn that the current price trend may soon reverse lower despite the fact traders remain netshort.
Technical Analysis
The DAX 30 may be at risk to a turn lower given the presence of negative RSI divergence, a sign of fading upside momentum. This is as prices struggle to push above the all-time high at 14169. In the event of a turn lower, keep a close eye on near-term rising support from November which may maintain the upside focus.
DAX 30 Daily Chart

DAX 30 Chart Created in Trading View
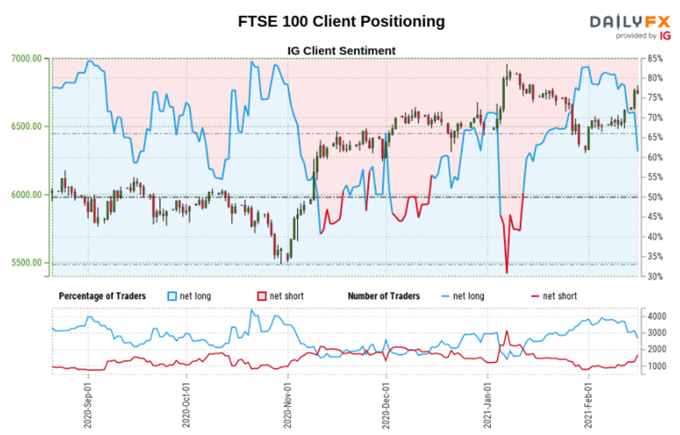
FTSE 100 Sentiment Outlook - Mixed
The IGCS gauge implies that about 64% of retail traders are net long the FTSE 100. Downside exposure has decreased by 4.37% over a daily basis while increasing 48.85% compared to last week. The combination of current sentiment and recent changes is offering a mixed trading bias.

Technical Analysis
The FTSE 100 remains in a consolidative state as the 6879 – 6964 resistance zone holds while rising support from November slowly guides the index higher. Prices recently closed above the 6624 inflection point, perhaps opening the door to revisiting 6964. But, the latter risks sending the UK benchmark stock index lower.
FTSE 100 Daily Chart

FTSE 100 Chart Created in Trading View
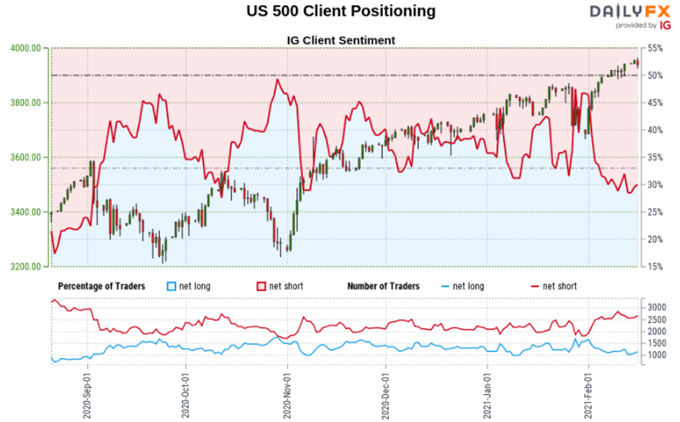
S&P 500 Sentiment Outlook - Bearish
The IGCS gauge implies that roughly 64% of retail traders are net long the S&P 500. Upside exposure climbed by 15.67% and 7.39% over a daily and weekly basis respectively. Recent changes in sentiment warn that the current price trend may soon reverse lower despite the fact traders remain net short.
Technical Analysis
Negative RSI divergence is warning that the S&P 500 may turn lower as upside momentum fades. The broader uptrend seems to be maintained by rising support from March – see chart below. Given the distance to the trendline, there may be room for losses in the near-term before there is a chance for the index to resume gains.
S&P 500 Futures Daily Chart

S&P 500 Chart Created in Trading View
*IG Client Sentiment Charts and Positioning Data Used from February 17th Report
--- Written by Daniel Dubrovsky, Strategist for DailyFX.com
To contact Daniel, use the comments section below or @ddubrovskyFX on Twitter


