


US Dollar, USD/SGD, USD/TWD, USD/THB, USD/IDR – ASEAN Technical Analysis
- Is the US Dollar attempting to stage a comeback against ASEAN FX?
- USD/SGD and USD/TWD are trading within bullish chart patterns
- USD/THB eyes a Symmetrical Triangle, USD/IDR to June 2020 lows

Singapore Dollar Technical Outlook
The US Dollar may be trying to set the stage for a comeback against the Singapore Dollar. USD/SGD is pressuring resistance of a bullish Falling Wedge chart pattern. A daily close above it, with confirmation, could open the door to extending gains. Such an outcome may place the focus on December highs. However, beyond that, falling resistance from June could maintain the broader downtrend. Resuming losses would place the focus on lows from 2018, highlighting support between 1.3010 and 1.3065.
USD/SGD Daily Chart
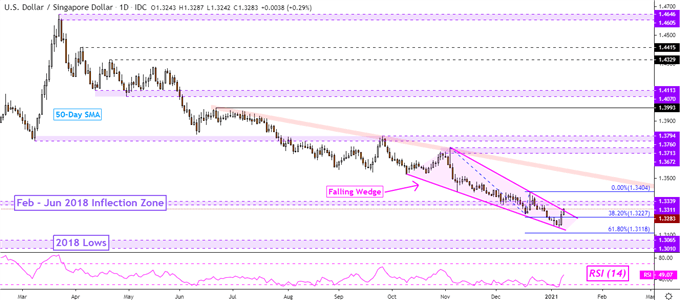
USD/SGD Chart Created in TradingView
New Taiwan Dollar Technical Outlook
The New Taiwan Dollar is also trading within a bullish Falling Wedge against the US Dollar. Overall, USD/TWD remains in a downtrend since August 2019. A climb above the Falling Wedge could place the focus on lows from 2011. Otherwise, downtrend resumption and break under the 78.6% Fibonacci extension at 27.9856 opens the door to testing the 100% level at 27.6090. Beyond that, the pair could face lows from 1996 to 1997.

USD/TWD Daily Chart
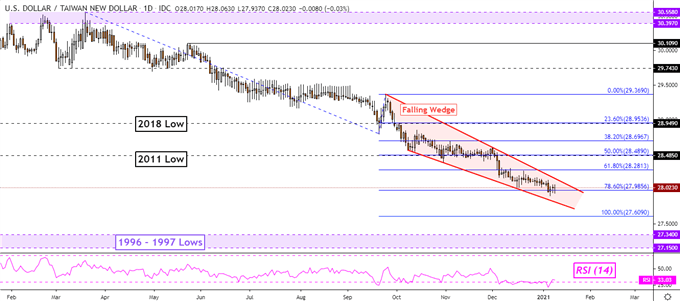
USD/TWD Chart Created in TradingView
Thai Baht Technical Outlook
Thailand’s Baht is trading within a neutral Symmetrical Triangle, which is typically a continuation pattern. As such, if USD/THB breaks lower, it could surpass the 2020 low at 29.72. However, a breakout above it may open the door to reversing recent losses. That may place the focus on the 61.8% Fibonacci extension at 30.3482, where beyond that sits the June low at 30.7450. Otherwise, taking out 29.72 exposes the 100% level at 29.4180.

USD/THB Daily Chart
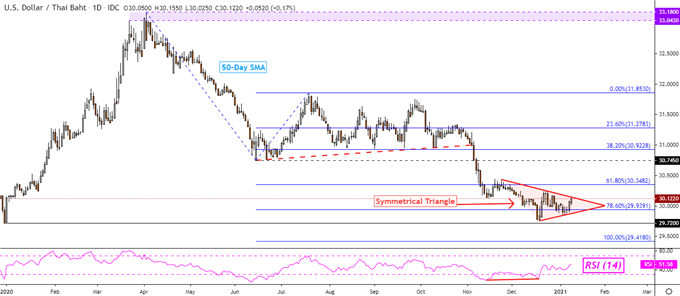
USD/THB Chart Created in TradingView
Indonesian Rupiah Technical Outlook
The Indonesian Rupiah is flirting with attempting to maintain its highest price against the US Dollar since February 2020. All eyes ate on June lows (13935 – 14012) to see if support holds. Positive RSI divergence does show that downside momentum is fading which can at times precede a turn higher. That may place the focus on falling resistance from late September. Otherwise, USD/IDR may extend losses towards the 2020 low at 13560.
For updates on ASEAN currencies as they break key technical levels, be sure to follow me on Twitter @ddubrovskyFX.
USD/IDR Daily Chart
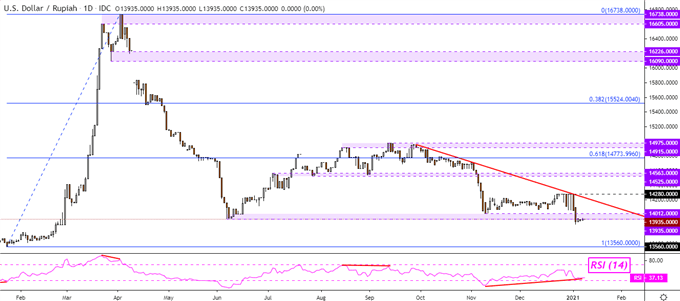
USD/IDR Chart Created in TradingView
--- Written by Daniel Dubrovsky, Currency Analyst for DailyFX.com
To contact Daniel, use the comments section below or @ddubrovskyFX on Twitter


