


Technical Outlook:
- EUR/JPY has room to drop before support
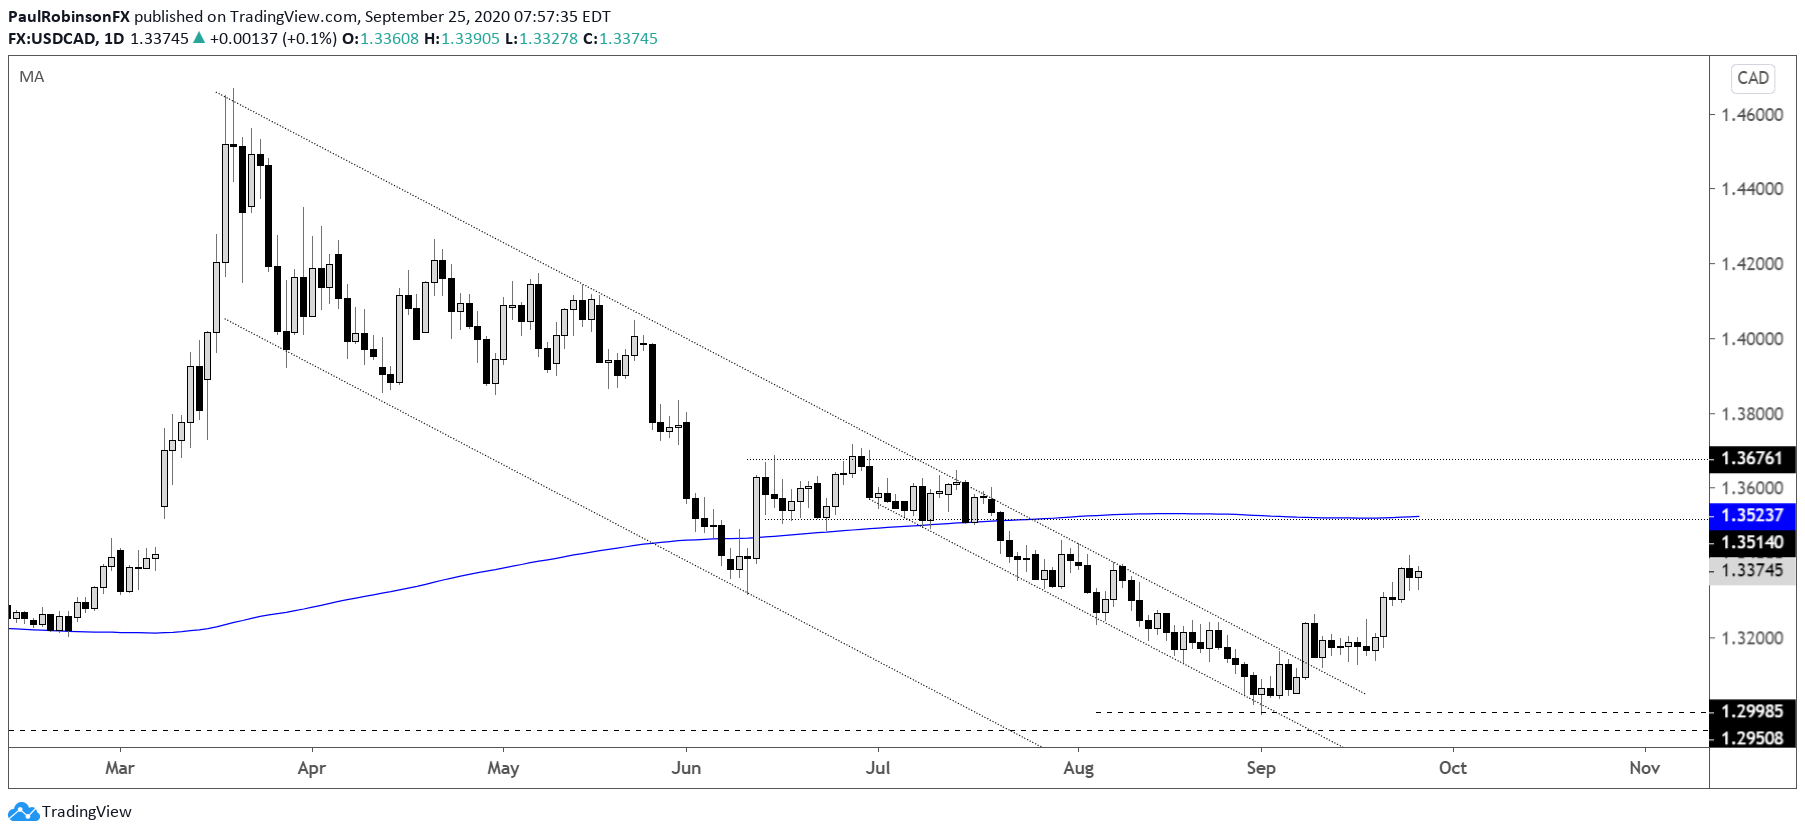
- USD/CAD could soon cross 13500
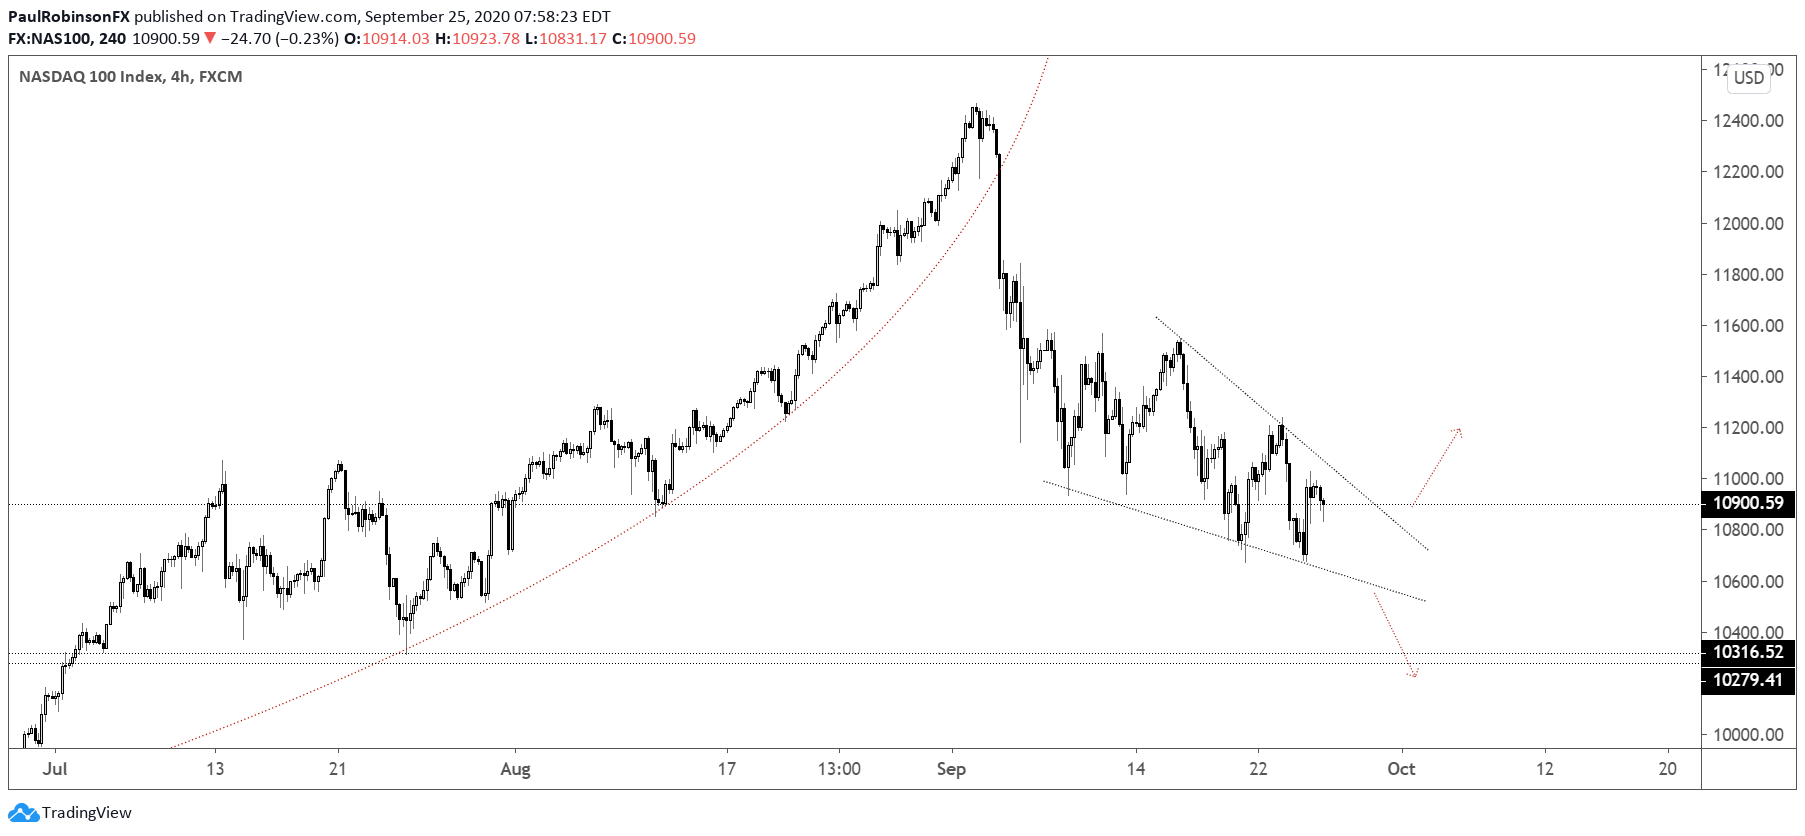
- Nasdaq 100 wedge viewed as significant
EUR/JPY is failing to garner any buying interest after declining below neckline support. The horizontal price action points towards lower prices ahead. The eyed level of support as a potential target is the 200-day moving average at 12088, which is in alignment with some peaks from earlier in the year.

EUR/JPY Daily Chart (sideways move to lead to support below)

USD/CAD is continuing to see buyers as it comes out of the low and USD remains generally bid across the board. The rise isn’t seen as having any significant obstacles until the 200-day MA, which is also in confluence with an extended range that formed during the summer. The area just above 13500 could be problematic, but if we continue to see stocks trade off aggressively and the USD further bid, then a break through resistance may be in the cards. Should we rise to around 13500, though, and see a rejection occur then a neutral to negative bias may be warranted.
USD/CAD Daily Chart (room up to 13500)
The Nasdaq 100 is carving out a descending wedge at this time. These falling type wedges after a decline are often thought of as bottoming sequences, but a downside break is certainly in the cards. Bottom line, go with the break of the pattern instead of trying to predict it. This could be highly influential on a lot of markets as a break from this pattern either implies more risk-on or risk-off.
Nasdaq 100 4-hr Chart (descending wedge)
Nasdaq 100 Chart by TradingView
Resources for Forex Traders
Whether you are a new or an experienced trader, DailyFX has several resources available to help you; indicator for tracking trader sentiment, quarterly trading forecasts, analytical and educational webinars held daily, and trading guides to help you improve trading performance.
---Written by Paul Robinson, Market Analyst
You can follow Paul on Twitter at @PaulRobinsonFX


