


US Dollar, USD/SGD, USD/MYR, USD/PHP, USD/IDR – ASEAN Technical Analysis
- US Dollar may push higher against its ASEAN FX peers
- USD/SGD, USD/MYR are eyeing bullish chart patterns
- Has USD/PHP bottomed? USD/IDR may bounce ahead
Singapore Dollar Technical Outlook
The US Dollar may be readying to extend gains against the Singapore Dollar. USD/SGD broke above the neckline of a bullish Double Bottom chart pattern. Confirmation is however lacking, a further daily close above 1.3718 may place the focus on the 1.3805 – 1.3820 inflection zone. Pushing beyond that exposes June peaks. Downtrend resumption entails a decline through the 1.3558 – 1.3571 inflection range.

USD/SGD Daily Chart
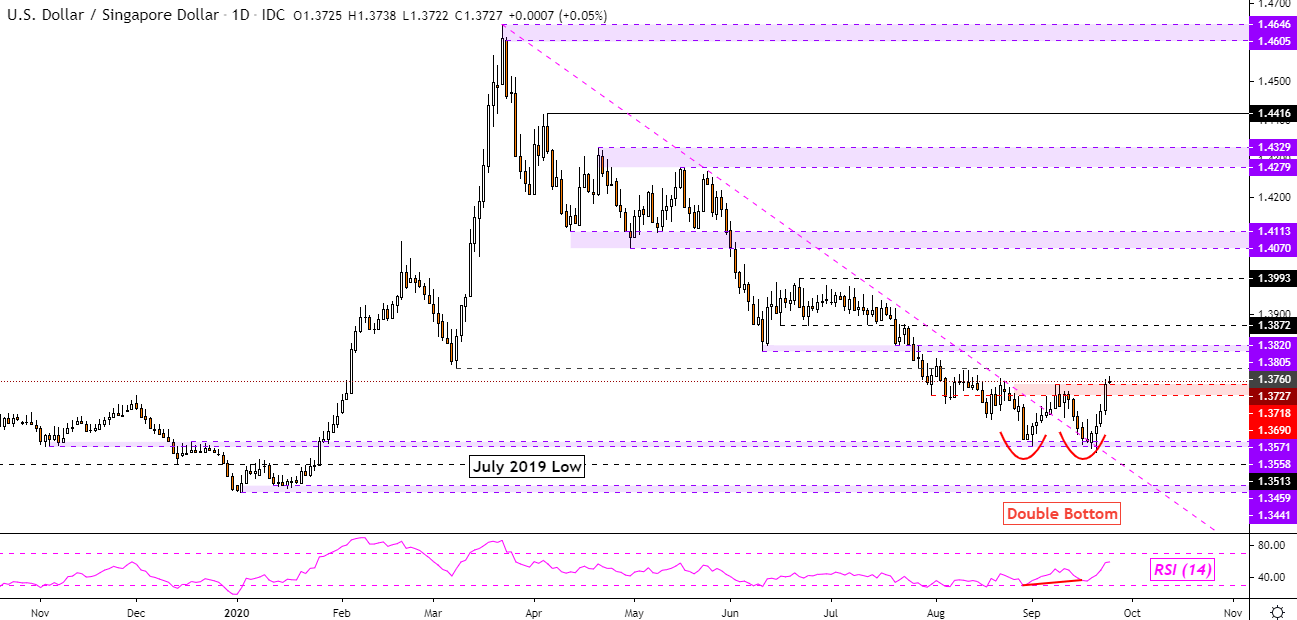
USD/SGD Chart Created in TradingView
Malaysian Ringgit Technical Outlook
The US Dollar could also be readying to climb versus the Malaysian Ringgit. USD/MYR is pressuring the ceiling of a bullish Falling Wedge chart pattern. A breakout higher, with confirmation, could see the pair set course to revisit the 4.2350 – 4.2450 inflection zone. Getting their entails taking out the 38.20% Fibonacci extension as well as the midpoint – see chart below. Otherwise, falling under 4.1100 exposes 4.0850.

USD/MYR Daily Chart
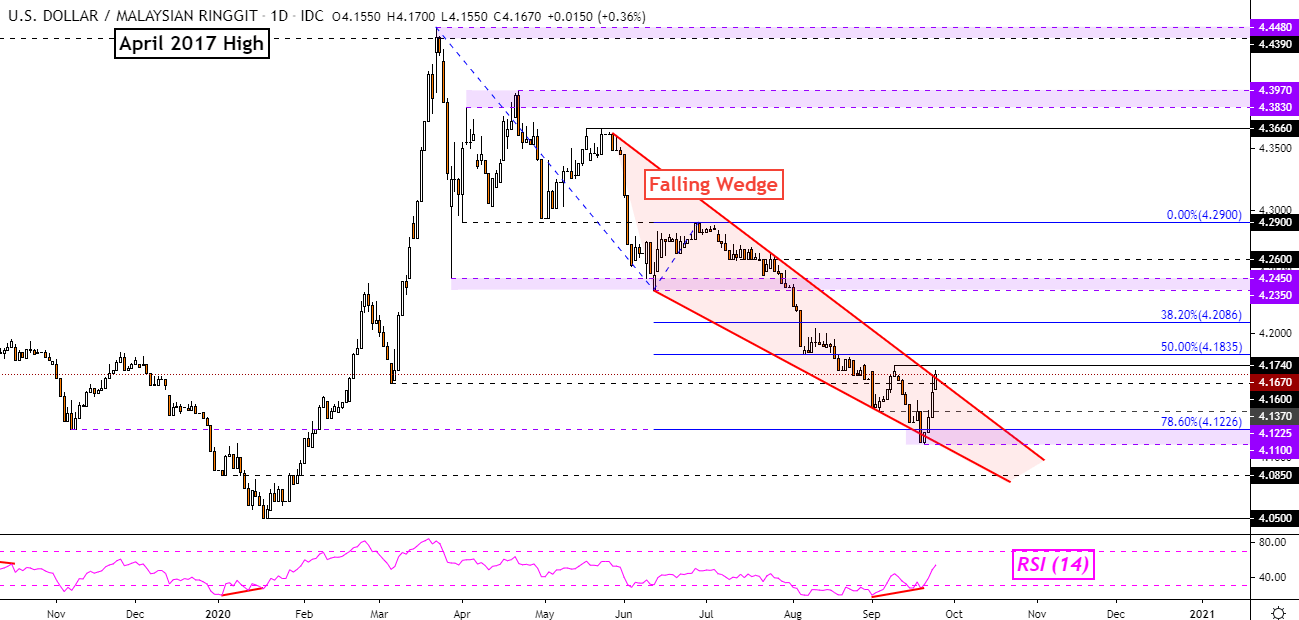
USD/MYR Chart Created in TradingView
Philippine Peso Technical Outlook
The US Dollar may have found a bottom against the Philippine Peso. USD/PHP pushed cautiously higher after testing the 48.28 – 48.36 support zone. This follows positive RSI divergence, a sign of fading downside momentum. A close above 48.6600, or the October 2016 high, may open the door to a reversal. The pair has also pushed above the 50-day Simple Moving Average (SMA). Though further confirmation is lacking.
USD/PHP Daily Chart
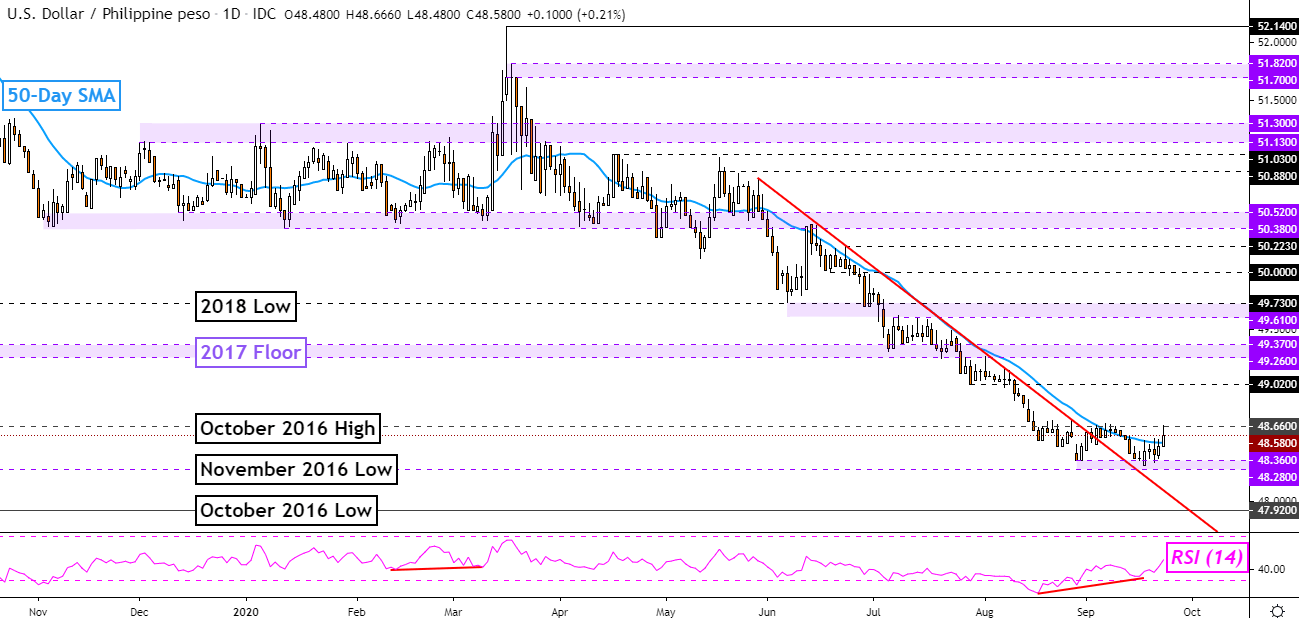
USD/PHP Chart Created in TradingView
Indonesian Rupiah Technical Outlook
The US Dollar seems to be trading within a bearish Rising Wedge chart pattern against the Indonesian Rupiah. USD/IDR bounced off the floor of the formation, perhaps opening the door to testing the 14915 – 14975 resistance range. A breakout below the wedge could open the door to a resumption of the downtrend from March – late May. Otherwise, a push above 14975 exposes 2018 highs.
For updates on ASEAN currencies as they break key technical levels, be sure to follow me on Twitter @ddubrovskyFX.
USD/IDR Daily Chart
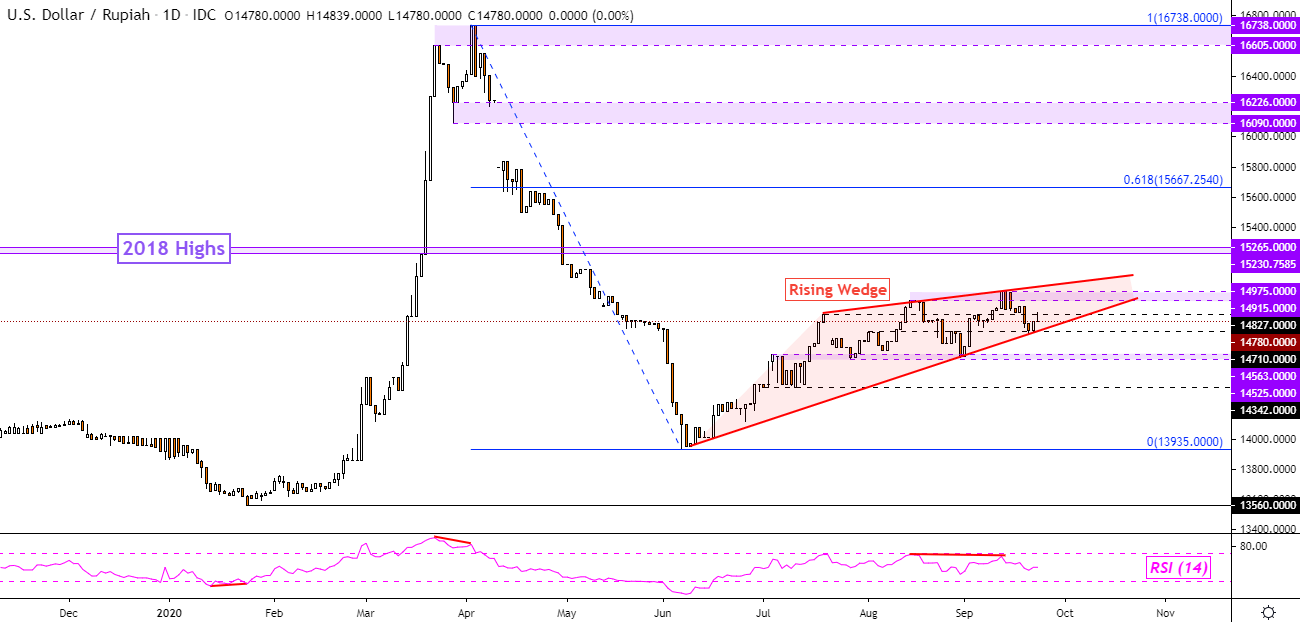
USD/IDR Chart Created in TradingView
--- Written by Daniel Dubrovsky, Currency Analyst for DailyFX.com
To contact Daniel, use the comments section below or @ddubrovskyFX on Twitter


