


S&P 500 and Dow Jones Trader Positioning - Talking Points
- IG Client Sentiment offers a mixed S&P 500 and Dow Jones outlook
- Technical signals seem to be pointing to the downside in both of them
In this week’s webinar on IG Client Sentiment (IGCS), I discussed the outlook for the S&P 500 and Dow Jones. IGCS is a contrarian indicator. For a deeper dive into what this means and for fundamental analysis, check out the recording of the session above where I also outlined the road ahead for crude oil prices starting around the 25-minute mark.
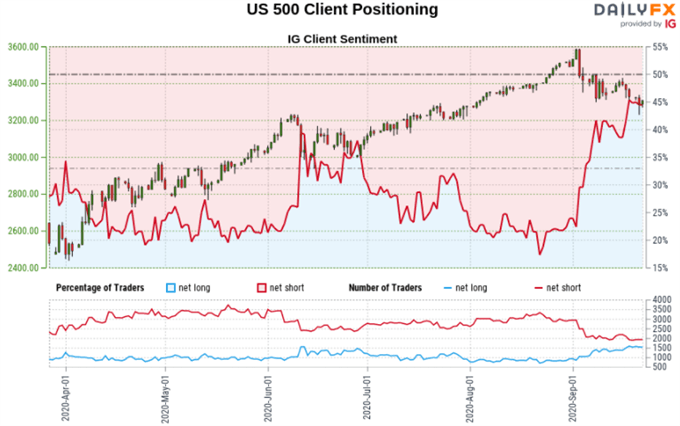
S&P 500 Sentiment Outlook - Mixed
The IGCS gauge implies that roughly 41% of retail traders are net long the S&P 500. Upside exposure has decreased by 7.89% over a daily basis while downside exposure increased 9.30% over the same period. The combination of current sentiment and recent changes offers a further mixedtrading bias.
S&P 500 Technical Analysis
From a technical standpoint, S&P 500 futures could be at risk to a deeper turn lower. This follows the formation of a bearish ‘Death Cross’ after the 20-day Simple Moving Average (SMA) crossed under the 50-Day SMA. That has placed the focus on the 3231 – 3213 inflection zone below as key support.
S&P 500 Futures – Daily Chart

S&P 500 Chart Created in Trading View
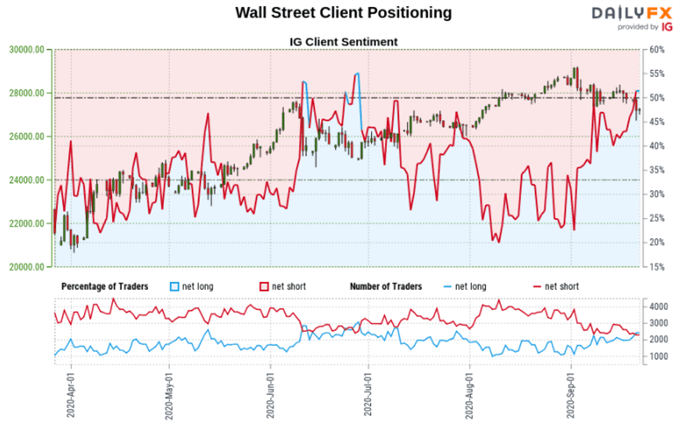
Dow Jones Sentiment Outlook - Mixed
The IGCS gauge implies that retail investors are about 49% net long the Dow Jones. Upside exposure has decreased by about 12 percent over a daily basis while downside bets have increased roughly 14% in the same time frame. The combination of current sentiment and recent changes offers a further mixed trading bias.

Dow Jones Futures Technical Analysis
Dow Jones futures may be at risk of further losses following the confirmation and breakout of a bearish Head and Shoulders chart pattern. This is also in tandem with a Death Cross between the 20-day and 50-day SMAs. Key support sits below as the 26494 – 26193 inflection zone followed by 25293.
Follow me on Twitter @ddubrovskyFX for updates on price trends and retail positioning!
Dow Jones Futures – Daily Chart

Dow Jones Chart Created in Trading View
*IG Client Sentiment Charts and Positioning Data Used from September 22nd Report
--- Written by Daniel Dubrovsky, Currency Analyst for DailyFX.com
To contact Daniel, use the comments section below or @ddubrovskyFX on Twitter


