


Nasdaq 100 Technical Highlights:
• Channel break risk climbing along with March low retest potential
• If bottom of channel can hold, though, slide can stay contained
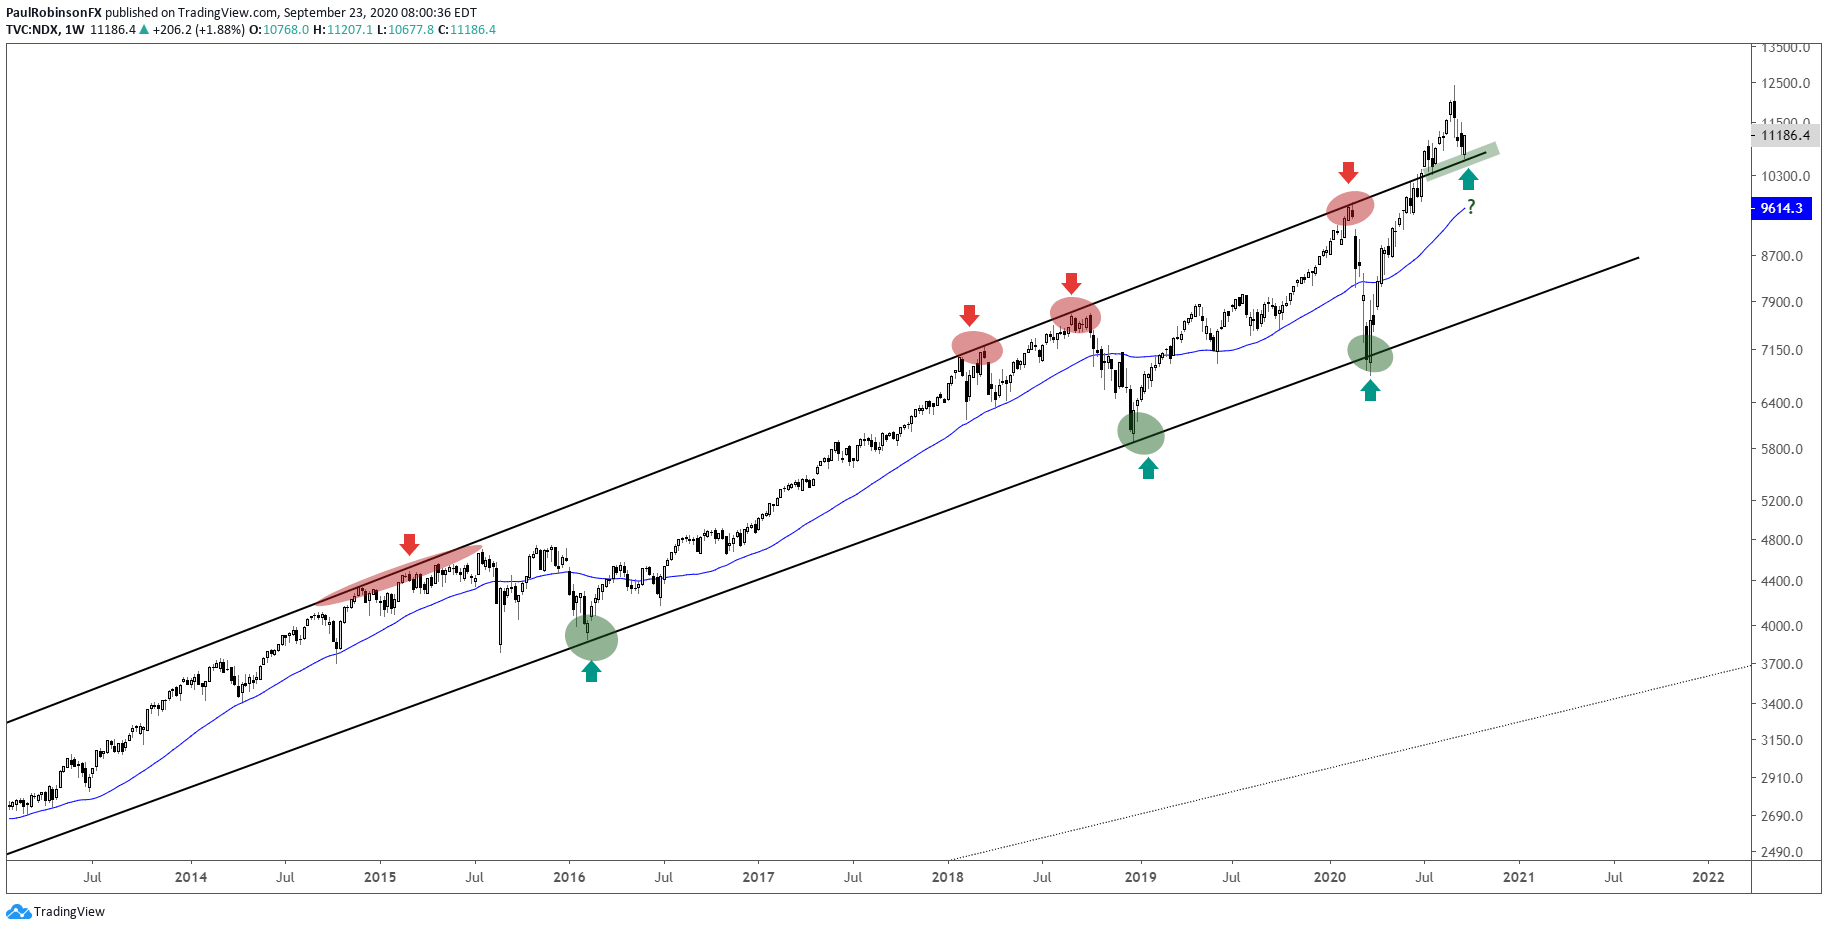
The Nasdaq 100 just pulled back near an important area of big-picture support via the top of the decade-long channel it left behind back in July. It is viewed as an important structure given its prevalence as support and resistance at times over such a long period of time.
When price exceeds the top of an upward sloping channel a couple of different things often happen. In one scenario we will see a smallish ‘overthrow’ where price rises for a relatively short period of time before momentum stalls and leads to a decline back inside the channel. At which time a full-on reversal can develop in the wake of a failure to maintain the trajectory. The overthrow is viewed as a sort of last ‘hurrah’, so to speak.
In the second scenario, price leaves the confines of the channel and it turns into a massive blow-off top by rising rapidly. While we are seeing the top of the channel get tested now, if price holds onto the upper parallel, then this could still be the case.
We do not need to predict how this will play out. The top of the channel is support at the moment and both scenarios could be in play. If we see it break, then switching to an aggressive bearish stance may be warranted. But until the upper threshold gives-way we must continue to respect it for what it remains – support. Perhaps it continues to hold, and another speculative wave comes in to push the market much higher before fizzling out.
In either case, whether we are on the verge of a major decline or a blow-off style rally continues to mount – the days of the tech stocks defying gravity look to be closer to the end than the beginning.
Nasdaq 100 Weekly Chart (Trying to hold top of channel)
Nasdaq 100 Daily Chart (Short-term unclear)

Nasdaq 100 Charts by Tradingview
Tools for Forex Traders
Whether you are a beginning or experienced trader, DailyFX has several resources available to help you; indicator for tracking trader sentiment, quarterly trading forecasts, analytical and educational webinars held daily, trading guides to help you improve trading performance, and one specifically for those who are new to forex.
---Written by Paul Robinson, Market Analyst
You can follow Paul on Twitter at @PaulRobinsonFX


