


USD Technical Outlook:
- DXY broke channel, has bottoming look to it
- EUR/USD still holding onto support (for now)
- USD/CAD working on building base for higher prices
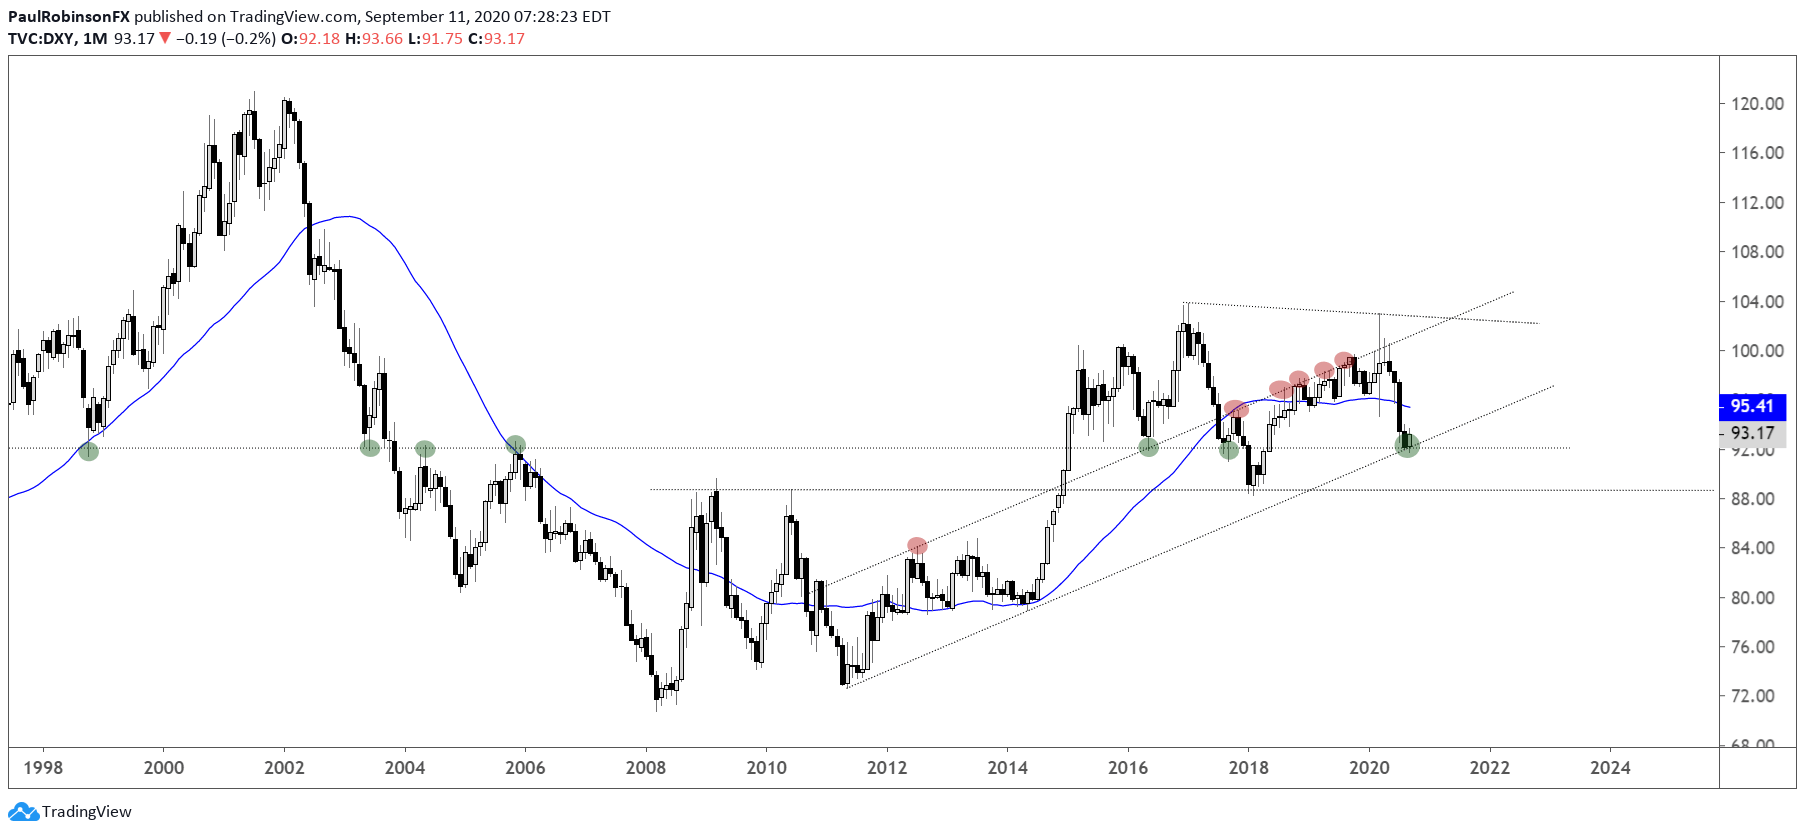
The US Dollar Index (DXY) is working on trying to rise off an area of confluence between a level that goes back as far as 1998 and a trend-line from 2011. This week the DXY was able to snap the downward channel dating back to May, and may be on the verge of posting an inverse head-and-shoulders pattern. Yesterday’s reversal post-ECB demonstrates bullish price action. A firm rise above 94 should have the USD gaining some good traction towards an important test of the March low at 94.65.
DXY Monthly Chart (trying to life off big support)
DXY Daily Chart (trying to life off big support)
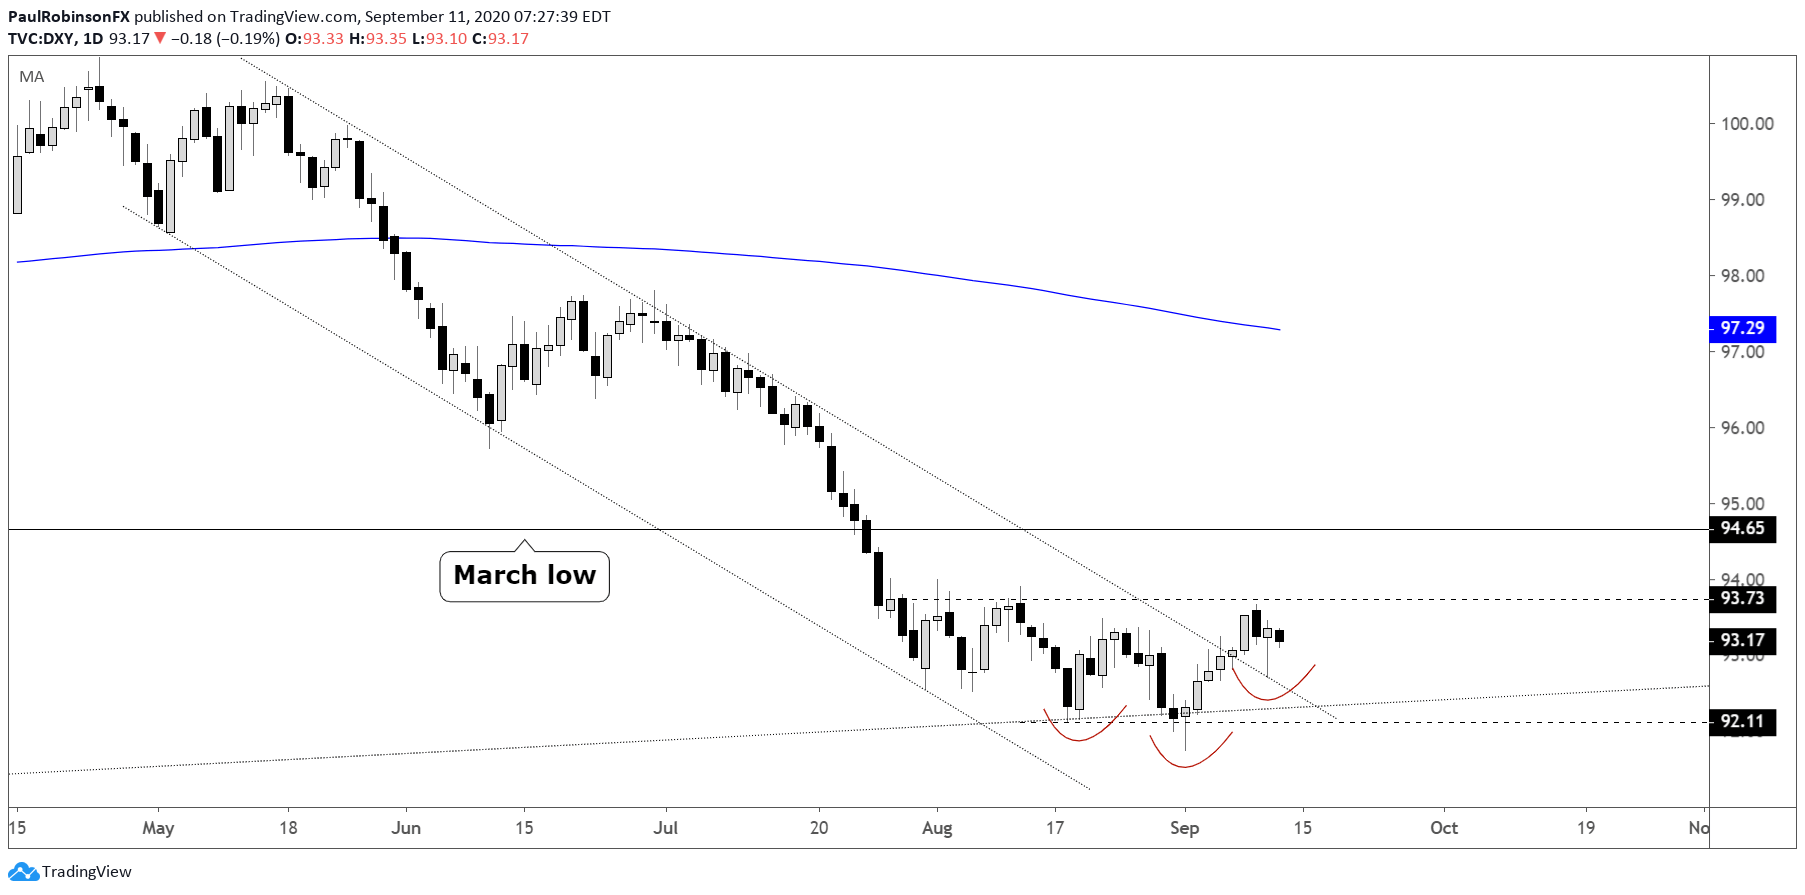
U.S. Dollar Currency Index (DXY) Charts by TradingView
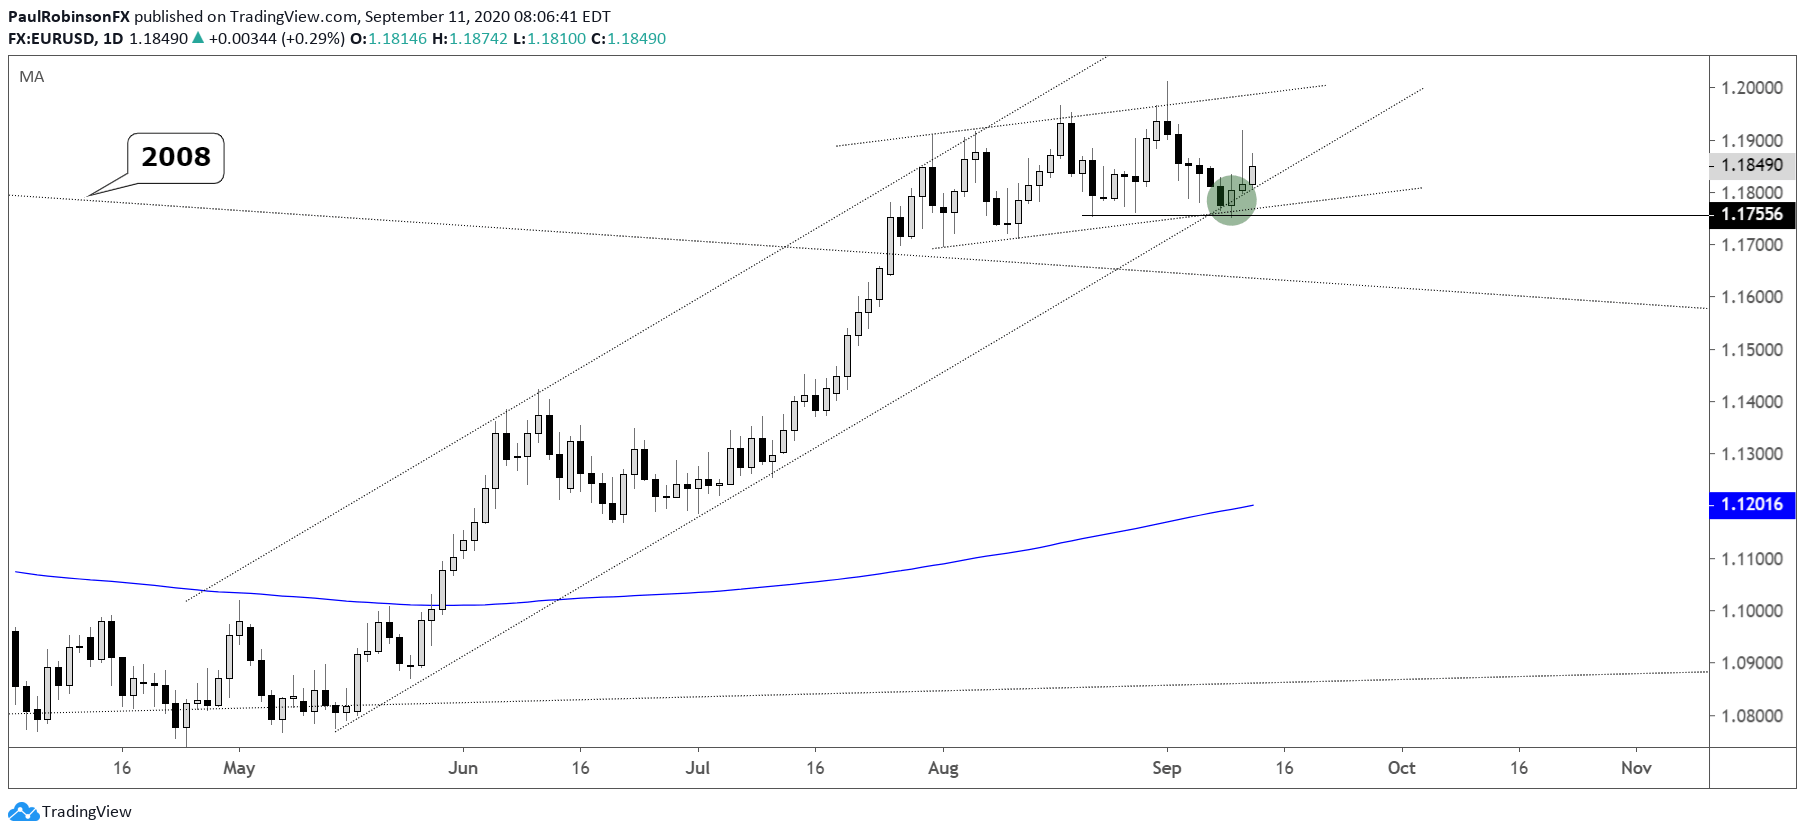
EUR/USD put in a solid bearish reversal candle yesterday post-ECB, it may mark the last push higher we see for a while should support just below break. There is a channel line from May along with some lows back to last month that are helping keep the upside intact. The general price action since the end of June could still be a bullish consolidation pattern or a topping sequence, which is why watching support here is important. A firm break below 11752 could mark the beginning of a sizable drop. Keep holding above support and at some point it is still possible EUR/USD gets into gear for a run…

EUR/USD Daily Chart (sitting on support)
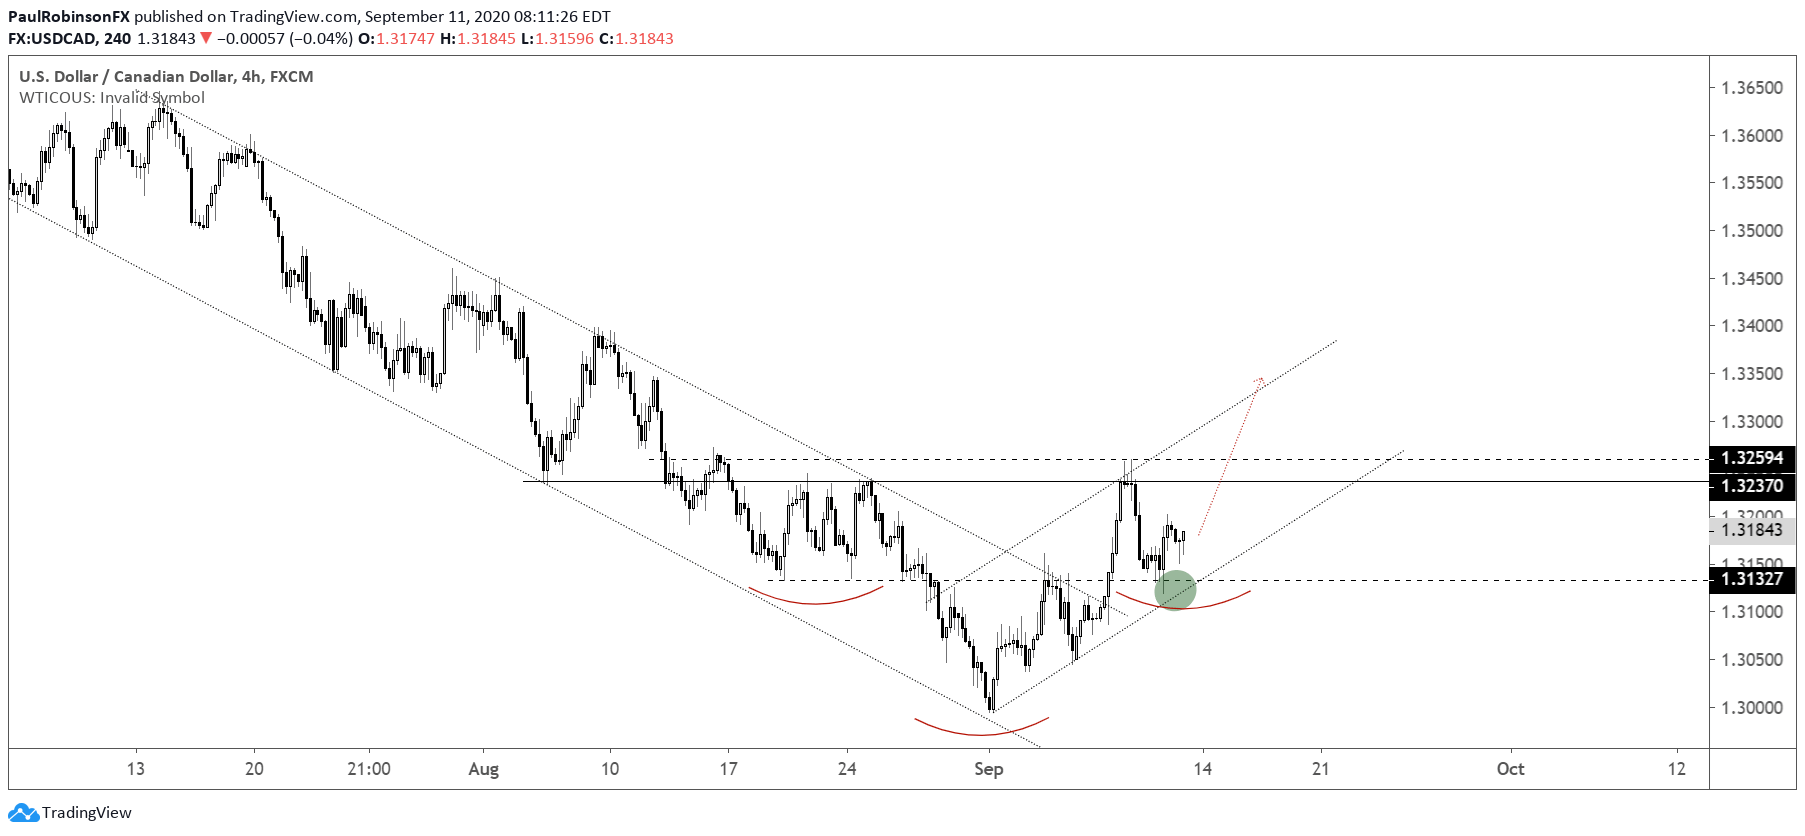
USD/CAD is working on an inverse head-and-shoulders pattern after breaking a downward channel. There are some good levels in the pair to watch between the 13130-area and around 13250. The lower threshold is working on supporting the shoulders while the upper level acts as the neckline. A push to around 13260 should have USD/CAD picking up steam. The channel off the lows can also be used as a guide moving forward.
USD/CAD 4-hr Chart (bottoming potential)
For all the charts we looked at, check out the video above…
Resources for Forex Traders
Whether you are a new or an experienced trader, DailyFX has several resources available to help you; indicator for tracking trader sentiment, quarterly trading forecasts, analytical and educational webinars held daily, and trading guides to help you improve trading performance.
---Written by Paul Robinson, Market Analyst
You can follow Paul on Twitter at @PaulRobinsonFX


