


S&P 500, Dow Jones, AUD/USD Trader Positioning - Talking Points
- IG Client Sentiment hints S&P 500 may fall
- Dow Jones outlook pointing bearish as well
- AUD/USD risks extending losses after top
In this week’s webinar on IG Client Sentiment (IGCS), I discussed the outlook for the S&P 500, Dow Jones and growth-linked Australian Dollar. IGCS is a contrarian indicator. For a deeper dive into what this means and for fundamental analysis, check out the recording of the session above where I also outlined the road ahead for NZD/USD, USD/JPY and GBP/JPY starting around the 30-minute mark.
S&P 500 Sentiment Outlook - Bearish
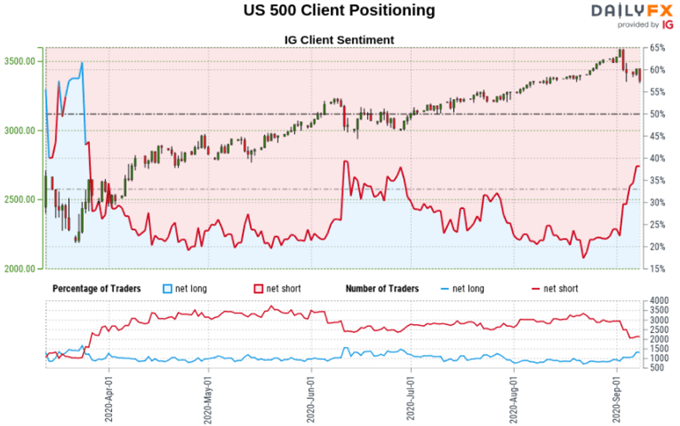
The IGCS gauge implies that roughly 44% of retail traders are net long the S&P 500. Exposure to the upside has swelled by 26.77% and 65.13% over a daily and weekly basis respectively. Recent changes in sentiment warn that the current price trend may soon reverse lower despite the fact traders remain netshort.
S&P 500 Technical Analysis
S&P 500 futures have confirmed a breakout under key rising support from March. Prices were then subsequently caught by the medium-term 50-day Simple Moving Average (SMA). A hold here could reinstate the focus to the upside as prices pressure former support from earlier this year between 3337 and 3397.

S&P 500 Futures – Daily Chart
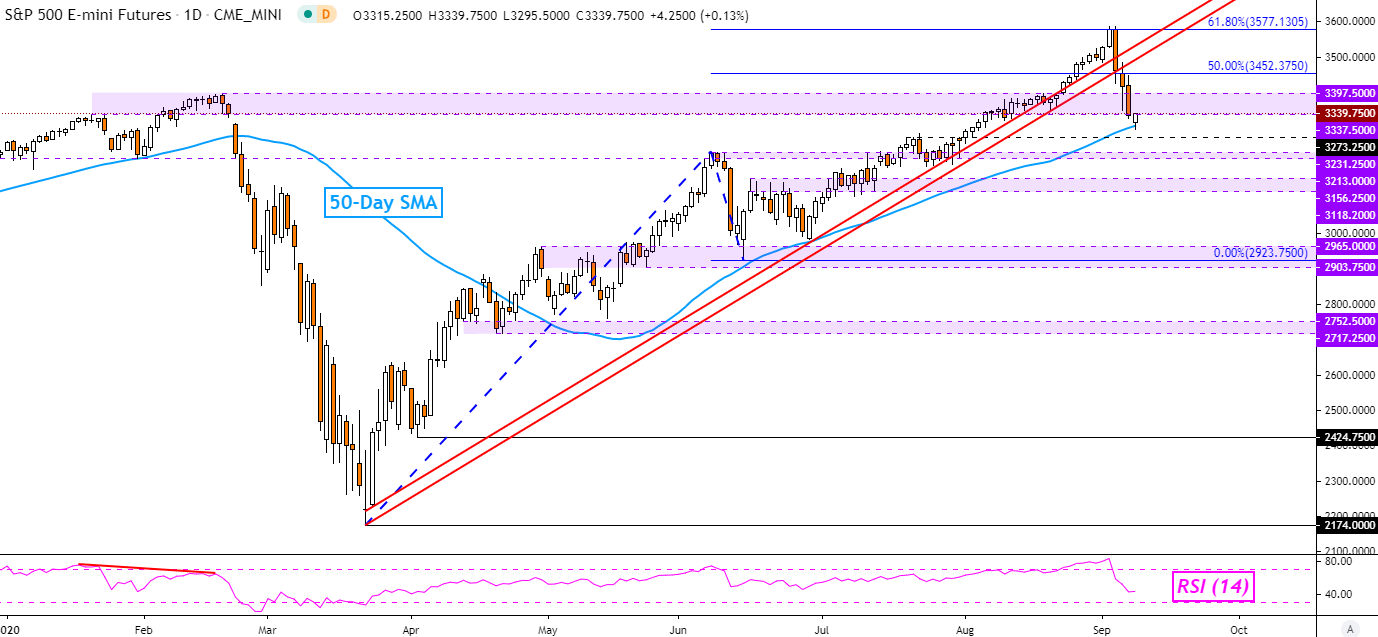
S&P 500 Chart Created in Trading View
Dow Jones Sentiment Outlook - Bearish
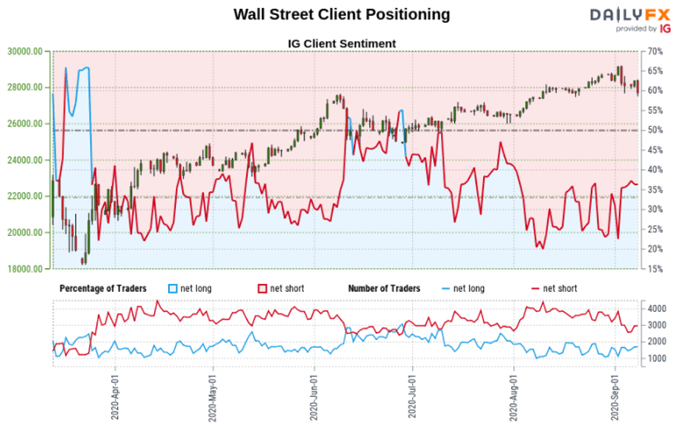
The IGCS gauge implies that roughly 49% of retail investors are net long the Dow Jones Industrial Average. Upside exposure has increased by 45.09% and 42.39% over a daily and weekly basis respectively. Recent changes in sentiment warn that the current price trend may soon reverse lower despite the fact traders remain netshort.
Dow Jones Futures Technical Analysis
Dow Jones futures are pressuring key rising support from May, though a downside breakout is unconfirmed. This follows a top just under highs from earlier this year, establishing key resistance between 29263 – 29523. Further losses, especially beyond the 50-day SMA, opens the door to a reversal towards the 26193 – 26494 inflection zone.
Follow me on Twitter @ddubrovskyFX for updates on price trends and retail positioning!
Dow Jones Futures – Daily Chart
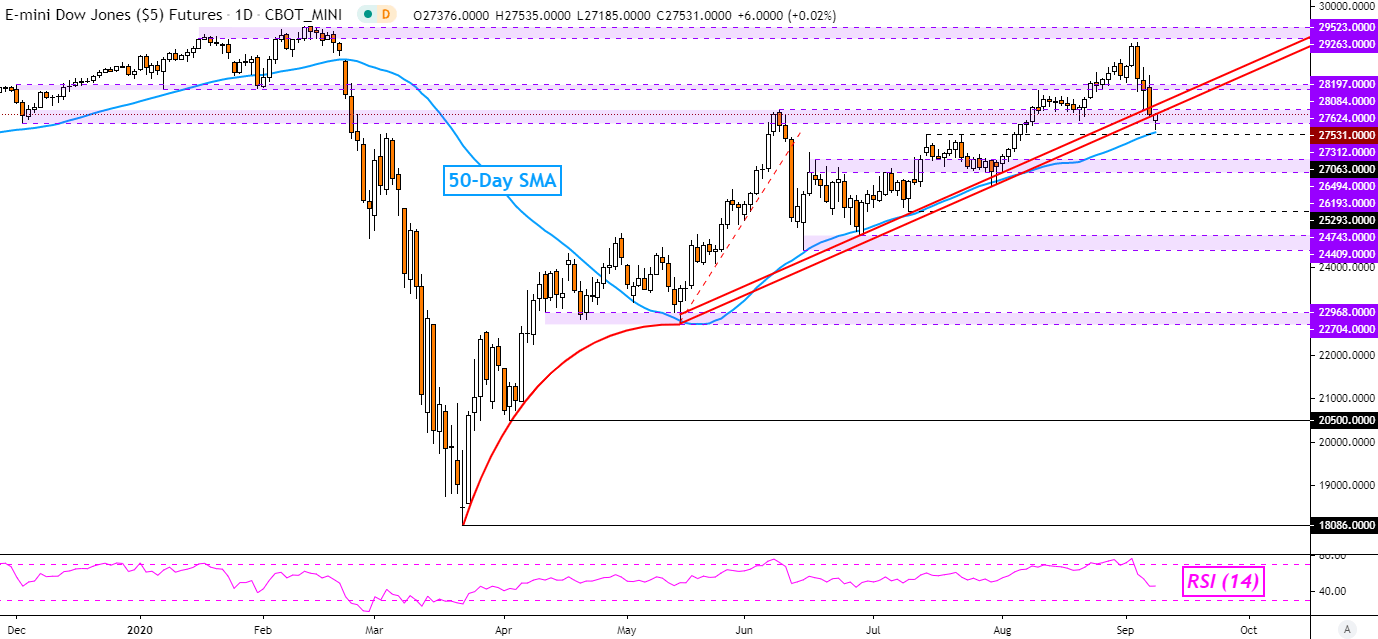
Dow Jones Chart Created in Trading View
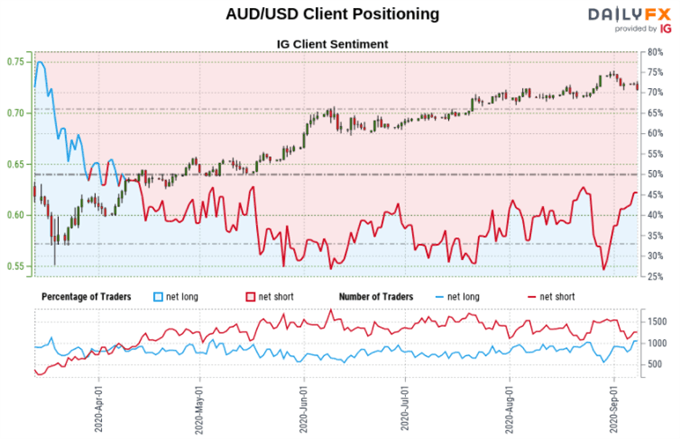
AUD/USD Sentiment Outlook - Bearish
The IGCS gauge implies that about 47% of retail traders are net long the sentiment-linked AUD/USD. Net long bets have decreased by 2.23% over a daily basis while rising 10.64% over a weekly period. Recent changes in sentiment warn that the current price trend may soon reverse lower despite the fact traders remain netshort.

AUD/USD Technical Analysis
AUD/USD recently extended losses after appearing to top around highs from December 2018. Prices have since inched closer to retesting the former falling trend line from 2013. Just below that sits the 50-day SMA. A combination of these could make for a key support zone, which if taken out, could risk a downside reversal.
AUD/USD – Daily Chart

AUD/USD Chart Created in Trading View
*IG Client Sentiment Charts and Positioning Data Used from September 8th Report
--- Written by Daniel Dubrovsky, Currency Analyst for DailyFX.com
To contact Daniel, use the comments section below or @ddubrovskyFX on Twitter


