


US Dollar, USD/SGD, USD/IDR, USD/MYR, USD/PHP – ASEAN Technical Analysis
- USD/SGD trades within a bullish chart pattern
- USD/IDR may extend losses after support break
- USD/MYR eyes March low, USD/PHP to rise?
Singapore Dollar Technical Outlook
The US Dollar continues to trade within a bullish Falling Wedge reversal chart pattern against the Singapore Dollar. USD/SGD attempted to break out higher since I noted the formation last week, but the ceiling held. This places the pair facing key support at 1.3628 as room to consolidate within the Falling Wedge narrows. A breakout lower would invalidate the setup while a push above the wedge top could open the door to a reversal, given confirmation. Further losses open the door to retesting current 2020 lows.

USD/SGD Daily Chart
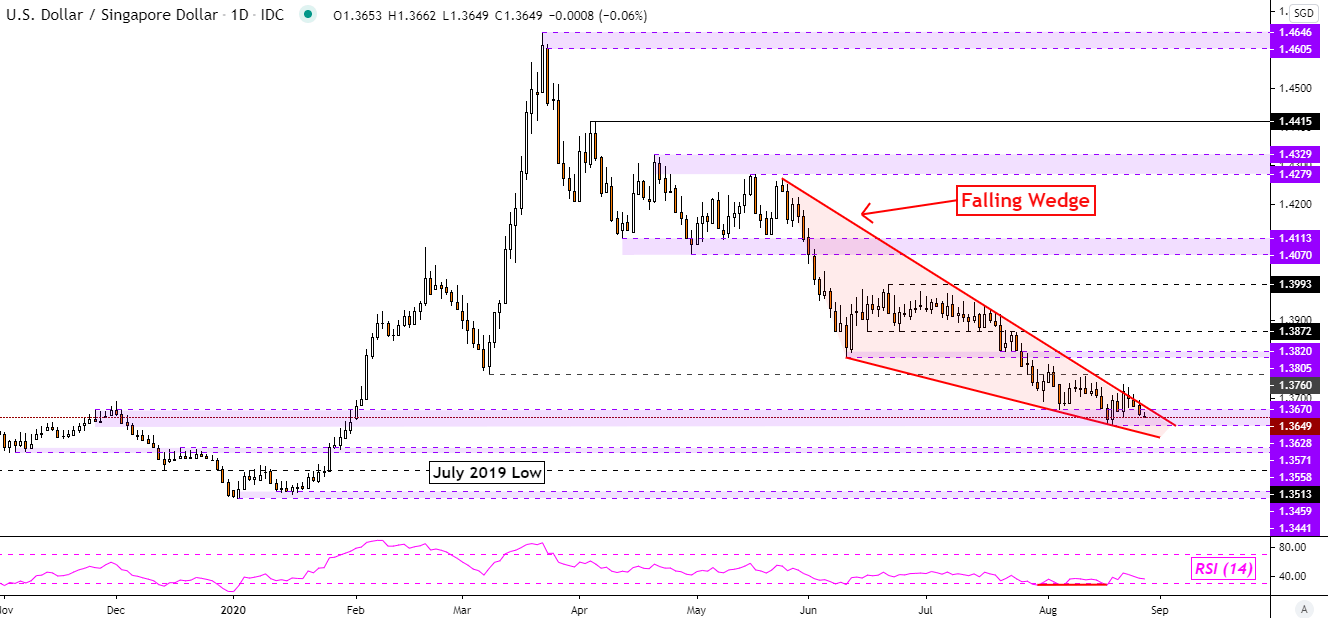
USD/SGD Chart Created in TradingView
Indonesian Rupiah Technical Outlook
The Indonesian Rupiah may be readying to extend recent gains against the US Dollar in the aftermath of the Bank of Indonesia monetary policy announcement. There the central bank stressed the importance of stabilizing its currency. Now, USD/IDR has closed under near term rising support from early June. A confirmatory downside close opens the door to extending losses. That places the focus on support at 14563 and the 50-day Simple Moving Average (SMA). The latter may reinstate the focus to the upside.
For updates on ASEAN currencies as they break key technical levels, be sure to follow me on Twitter @ddubrovskyFX.
USD/IDR Daily Chart
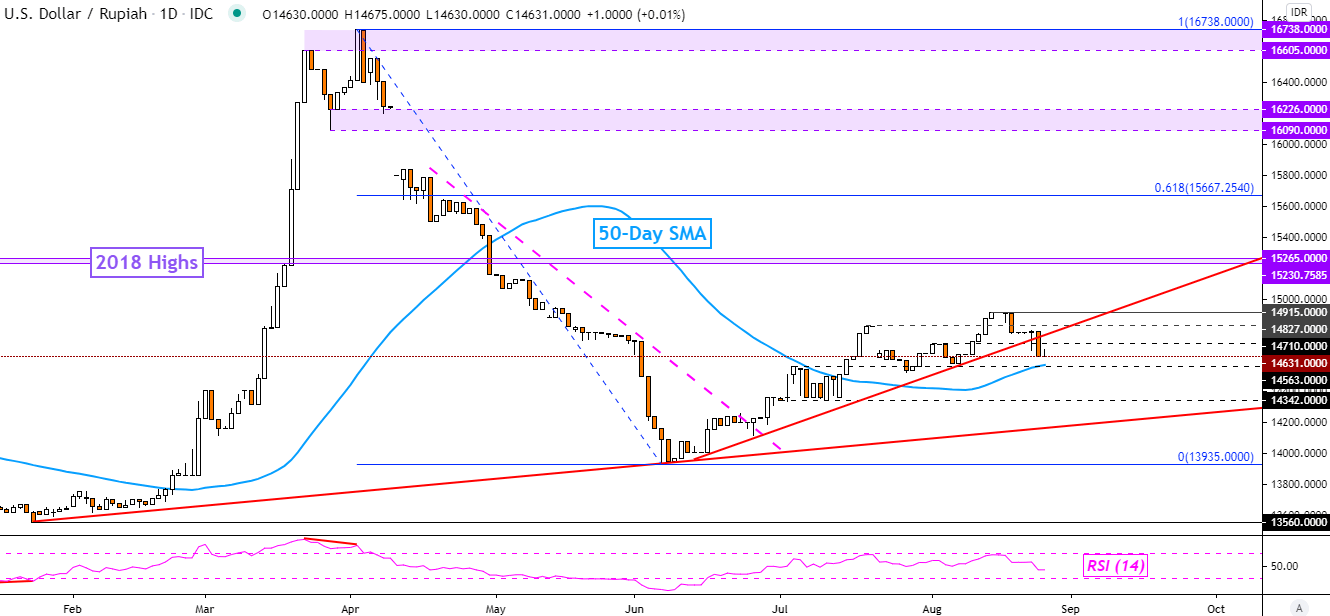
USD/IDR Chart Created in TradingView
Malaysian Ringgit Technical Outlook
The Malaysian Ringgit extended gains against the US Dollar. USD/MYR has been following the bearish implications of a Descending Triangle chart pattern. Recently, near term falling resistance from late July has been guiding the pair lower – pink line on the daily chart below. Now the pair is facing key support, which is the March low at 4.1600. A breakout to the downside could open the door to resuming the dominant downtrend on the way towards the 78.6% Fibonacci extension at 4.1226.

USD/MYR Daily Chart
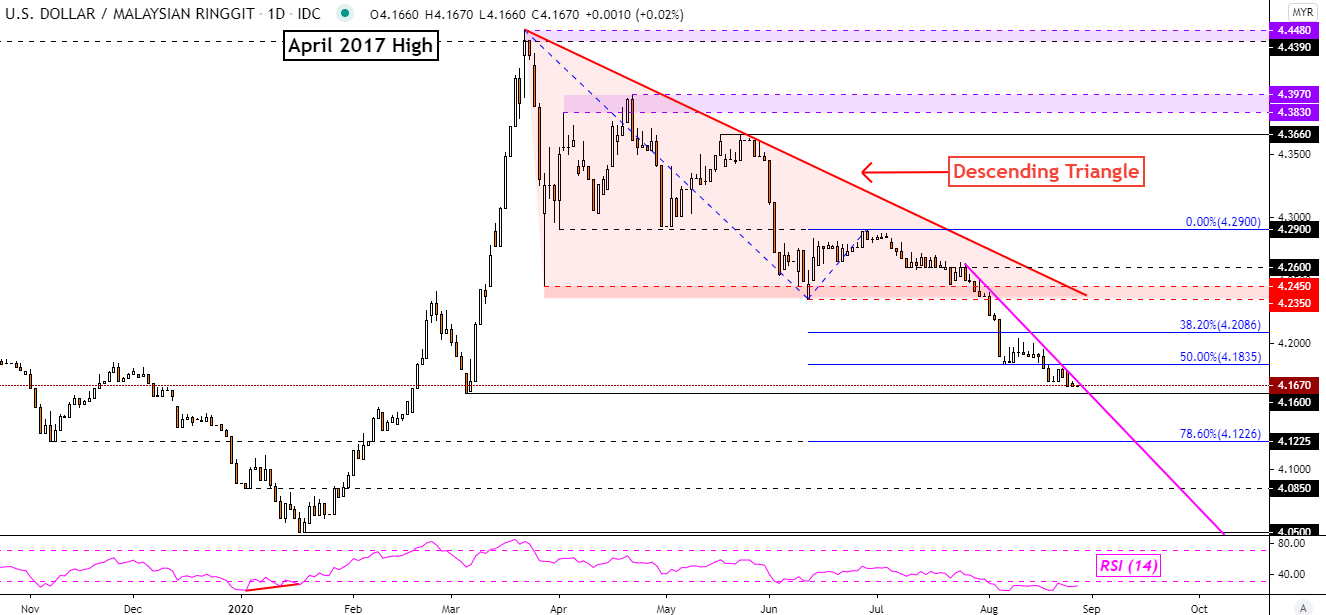
USD/MYR Chart Created in TradingView
Philippine Peso Technical Outlook
The US Dollar could turn higher against the Philippine Peso ahead. USD/PHP continues to struggle around the 78.6% Fibonacci extension at 48.53. Now positive RSI divergence shows that momentum to the downside is fading which can at times precede a turn higher. This will likely place the focus on key falling resistance from May – red line on the daily chart below. That trendline may reinstate the focus to the downside whereas a breakout higher could open the door to a reversal.
Find your trading personality and optimal forms of analysis
USD/PHP Daily Chart
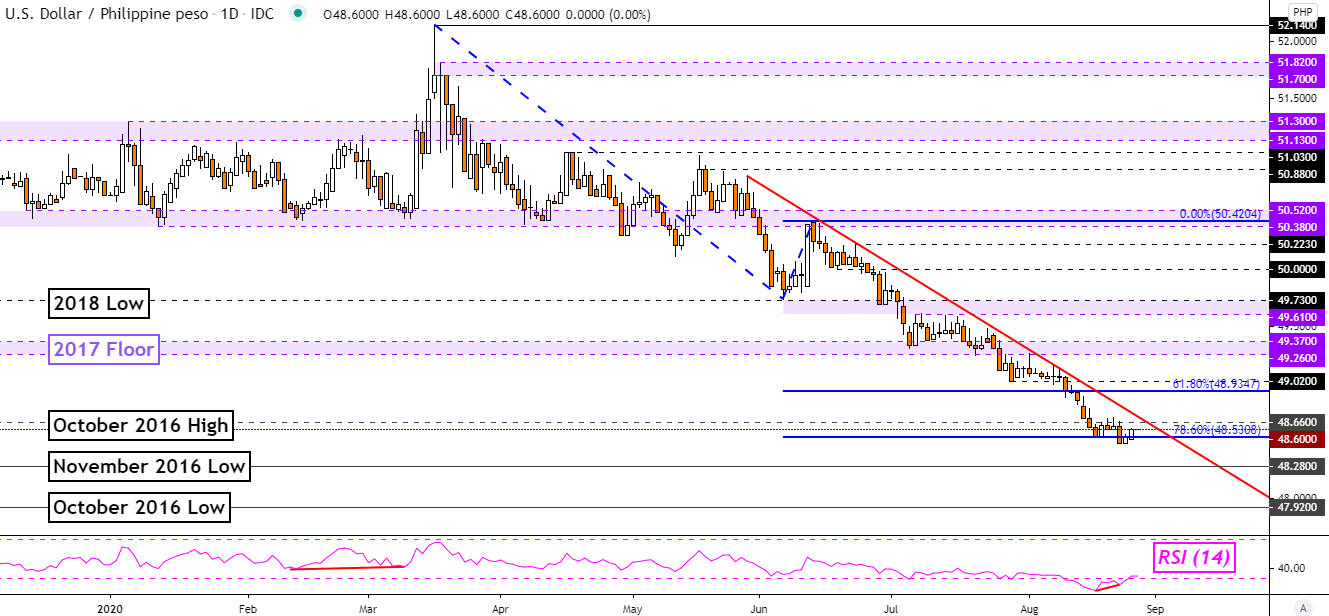
USD/PHP Chart Created in TradingView
--- Written by Daniel Dubrovsky, Currency Analyst for DailyFX.com
To contact Daniel, use the comments section below or @ddubrovskyFX on Twitter


