


S&P 500, Crude Oil, AUD/USD, Trader Positioning - Talking Points
- IG Client Sentiment hints S&P 500 could fall
- Crude oil prices may push past key resistance
- Rising long bets warn AUD/USD may decline
In this week’s session on IG Client Sentiment (IGCS), I discussed the outlook for the S&P 500, crude oil prices and AUD/USD. IGCS is a contrarian indicator. For a deeper dive into what this means and for fundamental analysis, check out the recording of the session above.
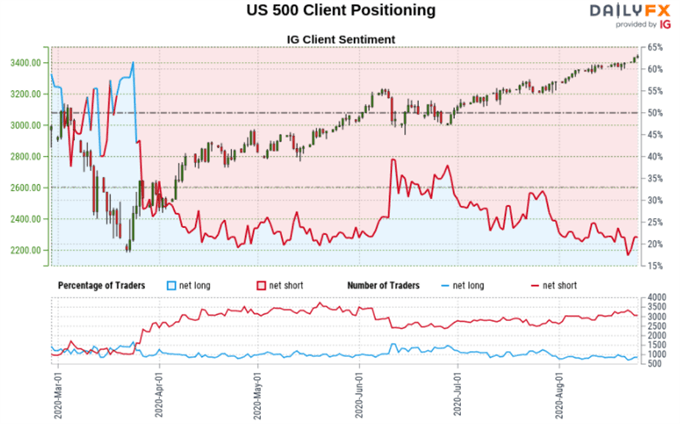
S&P 500 Sentiment Outlook - Bearish
The IGCS gauge implies that about 26% of retail investors are net long the S&P 500. Exposure to the upside has increased by 17.20% and 9.77% over a daily and weekly basis respectively. Recent changes in sentiment warn that the current price trend may soon reverse lower despite the fact traders remain netshort.
S&P 500 Technical Analysis
S&P 500 futures recently closed at an all-time high, stopping short of the midpoint of the Fibonacci extension at 3452. Guiding the S&P 500 higher appears to be rising support from March’s bottom, red parallel lines on the daily chart below. A breakout under rising support could open the door to a reversal towards 3337.

S&P 500 Futures – Daily Chart

S&P 500 Chart Created in Trading View
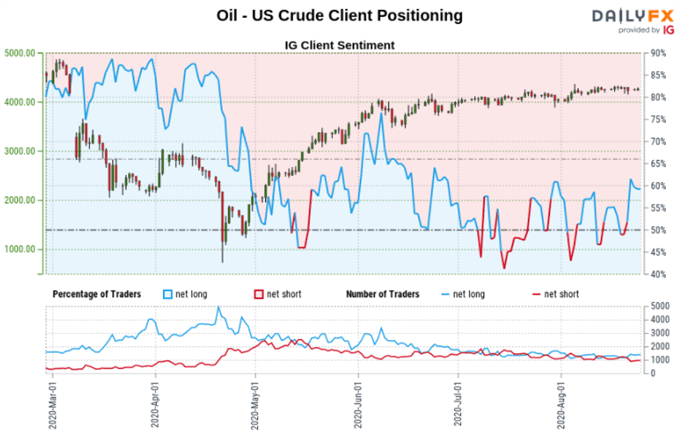
Crude Oil Sentiment Outlook - Bullish
The IGCS gauge implies that about 45% of retail investors are net long crude oil. Net short bets have increased by 27.17% and 10.41% over a daily and weekly basis respectively. The combination of current sentiment and recent changes offers a stronger bullish contrarian trading bias.
Develop the discipline and objectivity you need to improve your approach to trading consistently
Crude Oil Technical Analysis
WTI crude oil prices are pushing deeper into the key 42.91 – 43.87 inflection zone. A breakout to the upside would expose lows from January around 49.42 which could act as new resistance. Key support sit below as a combination of the 20-day and 50-day Simple Moving Averages (SMAs).
Follow me on Twitter @ddubrovskyFX for updates on price trends and retail positioning!
WTI Crude Oil – Daily Chart

Crude Oil Chart Created in Trading View
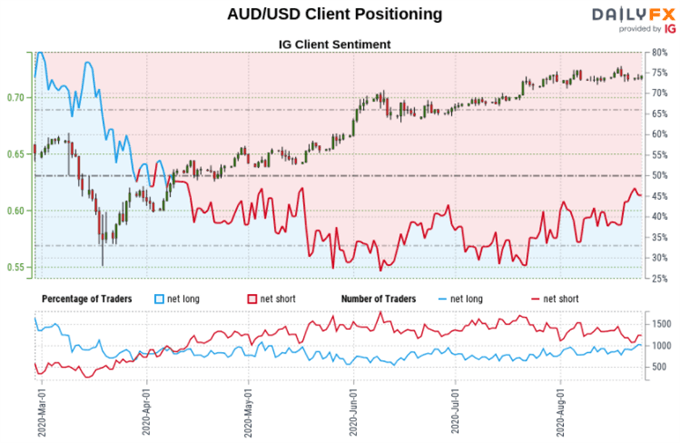
Australian Dollar Sentiment Outlook - Bearish
The IGCS gauge implies that roughly 45% of retail traders are net long AUD/USD. Upside exposure has increased by 5.20% and 30.24% over a daily and weekly basis respectively. From here, recent changes in sentiment warn that the current price trend may soon reverse lower despite the fact traders remain net-short.

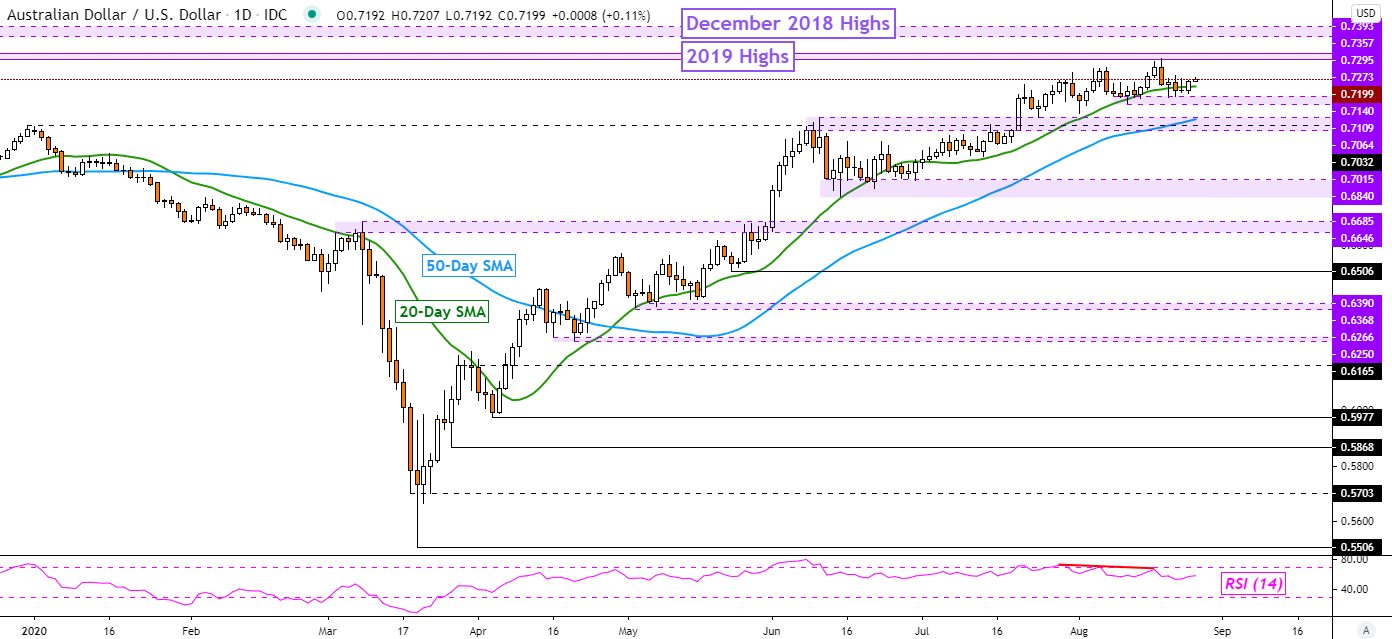
Australian Dollar Technical Analysis
The 20-day SMA continues to maintain the focus to the upside for AUD/USD. Below sits the 0.7109 – 0.7140 support zone which if taken out, exposes the 50-day SMA. Uptrend resumption entails clearing peaks from 2019 which could make for z range of resistance between 0.7273 and 0.7295.
AUD/USD – Daily Chart
AUD/USD Chart Created in Trading View
*IG Client Sentiment Charts and Positioning Data Used from August 25th Report
--- Written by Daniel Dubrovsky, Currency Analyst for DailyFX.com
To contact Daniel, use the comments section below or @ddubrovskyFX on Twitter


