


Japanese Yen, Nikkei 225, AUD/JPY - Talking Points
- Japanese Yen may be readying to extend losses
- Will Nikkei 225 futures overcome key resistance?
- AUD/JPY idling as prices test trendline support
Despite recent gains, the anti-risk Japanese Yen could be readying to resume losses against its major counterparts. On the daily chart below is my majors-based Yen index which is trading within a bearish Descending Triangle chart pattern. It also continues to oscillate under key rising support from 2018. Now the index is facing key resistance, a combination of the ceiling of the triangle and the former trendline.

These could reinstate the focus to the downside as the Japanese Yen shoots to trade for its average cheapest price since early August. Yet, a breakout under the triangle could be met with some hesitation. A combination of lows from late 2019 and early 2020 form a wide range of support. As such, traders ought to proceed with some degree of caution in the event of weakness in the Yen in the coming days and weeks.
Develop the discipline and objectivity you need to improve your approach to trading consistently
Majors-Based Japanese Yen Index – Daily Chart
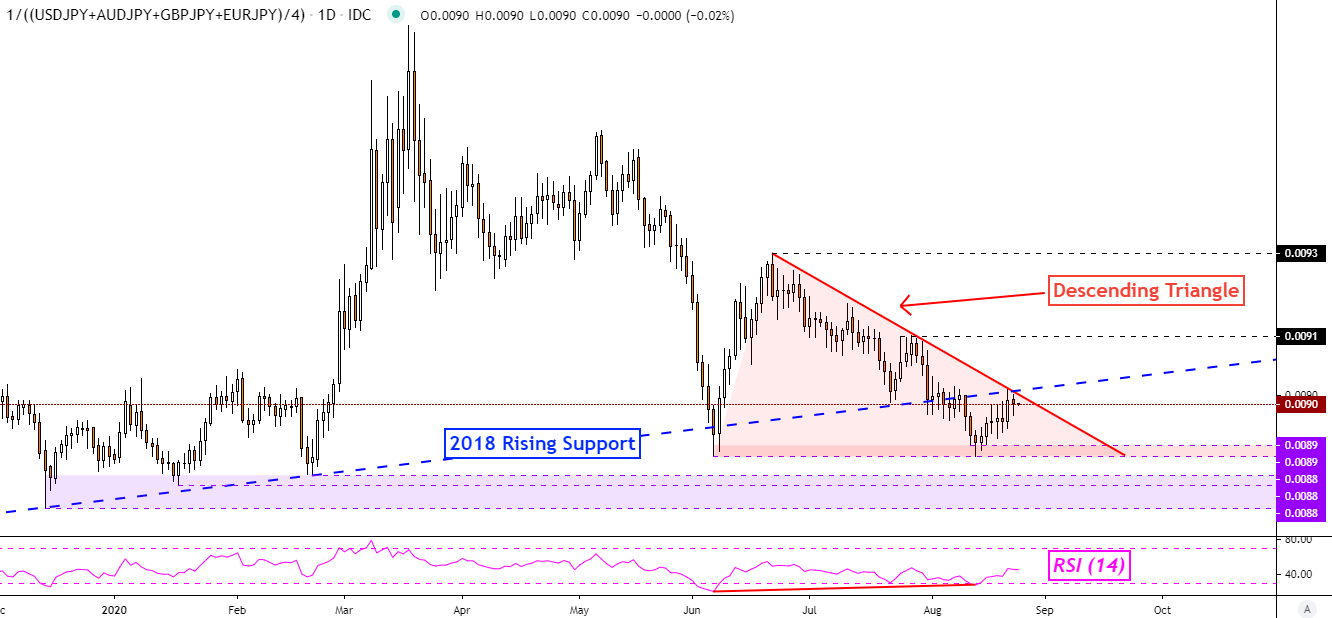
*Majors-Based Japanese Yen Index Averages JPY Against USD, AUD, GBP and EUR
Nikkei 225 Technical Analysis
Given the Yen’s sensitivity to risk appetite, a catalyst that could extend weakness in JPY might come from fundamental forces that boost the Nikkei 225, Japan’s benchmark stock index, and global equities. In the near term, the Federal Reserve’s annual Economic Policy Symposium could be a downside risk for stocks this week. That could in turn boost the Japanese Yen.

From a technical standpoint, the Nikkei 225 (futures below) has been struggling to find direction since early June. Key resistance seems to sit above between 23190 – 23340 with an inflection zone immediately below at 22650 – 22900. A push under the latter may not necessarily mean that a reversal is in the cars. Key support could rekindle bulls at 2130 – 21680, even if the 20 and 50-day Simple Moving Averages (SMAs) are taken out.
Nikkei 225 Futures – Daily Chart

AUD/JPY Technical Analysis
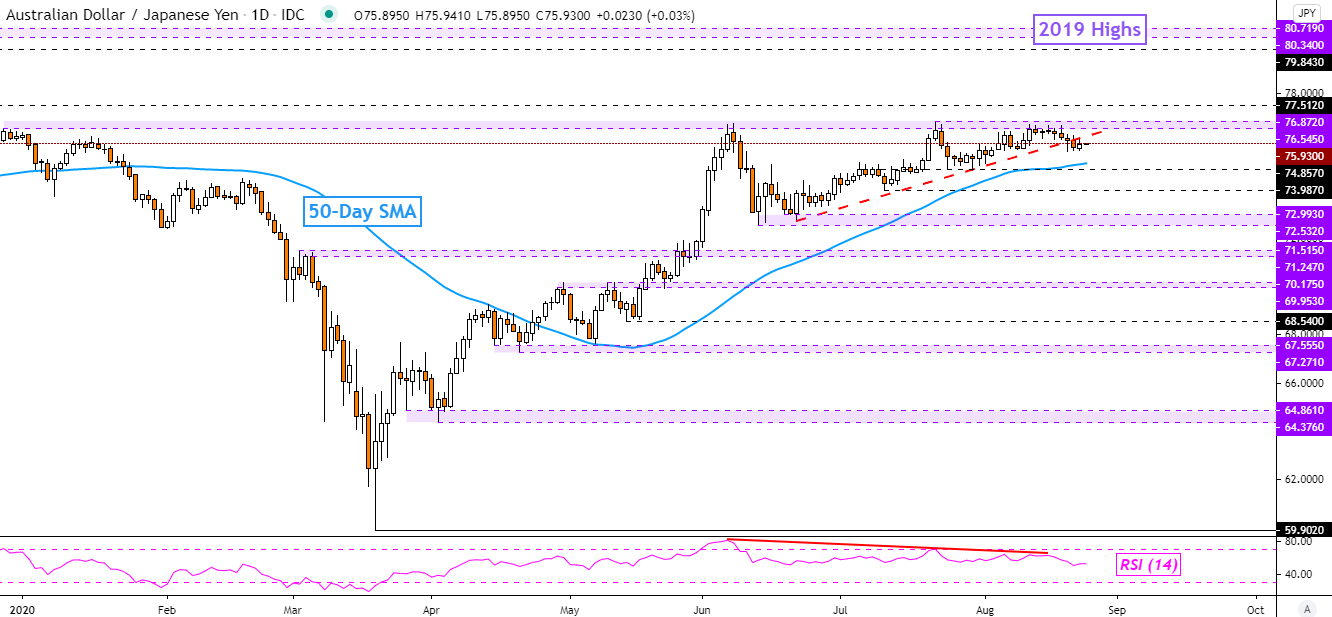
Pairing the anti-risk Yen against the growth-linked Australian Dollar arguably results in one of the more stock-sensitive forex pairs, AUD/JPY. It appears to have taken out near term rising support from June, though confirmation seems to be lacking at this point. A test of the 50-day SMA could precede a bounce towards critical resistance which seems to be a range between 76.54 and 76.87. A daily close above the latter, with confirmation, could open the door to retesting peaks from 2019.
| Change in | Longs | Shorts | OI |
| Daily | 0% | 11% | 5% |
| Weekly | 29% | -25% | -3% |
AUD/JPY – Daily Chart
--- Written by Daniel Dubrovsky, Currency Analyst for DailyFX.com
To contact Daniel, use the comments section below or @ddubrovskyFX on Twitter


