


Dow Jones, S&P 500, NZD/USD, Trader Positioning - Talking Points
- IG Client Sentiment hints Dow Jones may fall next
- Will S&P 500 follow or continue setting new highs?
- NZD/USD at risk to turning lower as long bets rise
In this week’s session on IG Client Sentiment (IGCS), I discussed the outlook for the Dow Jones, S&P 500 and NZD/USD. IGCS is a contrarian indicator. For a deeper dive into what this means and for fundamental analysis, check out the recording of the session above.
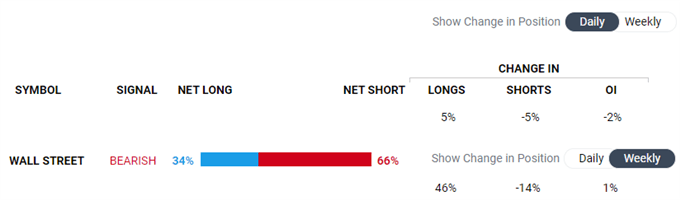
Dow Jones Sentiment Outlook - Bearish
The IGCS gauge implies that about 34% of retail traders are net long the Dow. Upside exposure has increased by 5% and 46% over a daily and weekly basis respectively. The combination of current sentiment and recent changes offers abearish contrarian trading bias.
Dow Jones Technical Analysis
Dow Jones futures are idling just under the key 28084 – 28197 inflection zone. A turn lower from here places the focus on the 27312 – 27624 inflection range with key rising support from May sitting just below. The latter could reinstate the focus to the upside. A push above 28197 exposes early 2020 peaks.
Follow me on Twitter @ddubrovskyFX for updates on price trends and retail positioning!
Dow Jones Futures – Daily Chart
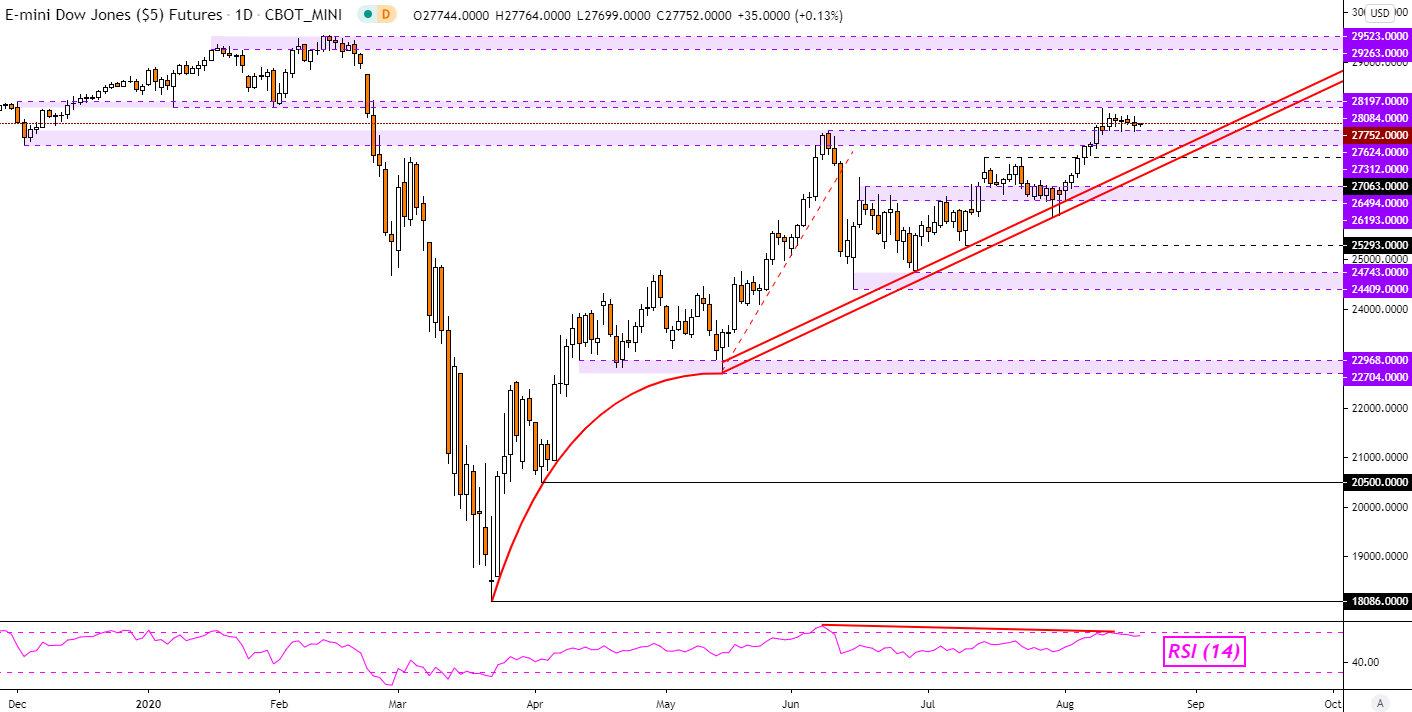
Dow Jones Chart Created in Trading View
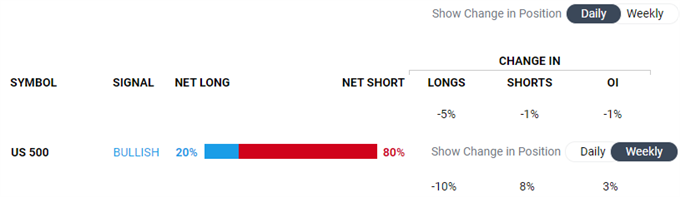
S&P 500 Sentiment Outlook - Bullish
The IGCS gauge implies that about 20% of retail traders are net long the S&P 500. Exposure to the upside has decreased by 5% and 10% over a daily and weekly basis respectively. The combination of current sentiment and recent changes offers a bullish contrarian trading bias.
Develop the discipline and objectivity you need to improve your approach to trading consistently
S&P 500 Technical Analysis
S&P 500 futures closed at a record high over the past 24 hours, though remain under the all-time high set on February 20 which makes for key resistance at 3397. A push above this price exposes the midpoint of the Fibonacci extension at 3452. Otherwise, a turn lower places the focus on rising support from April.

S&P 500 Futures – Daily Chart
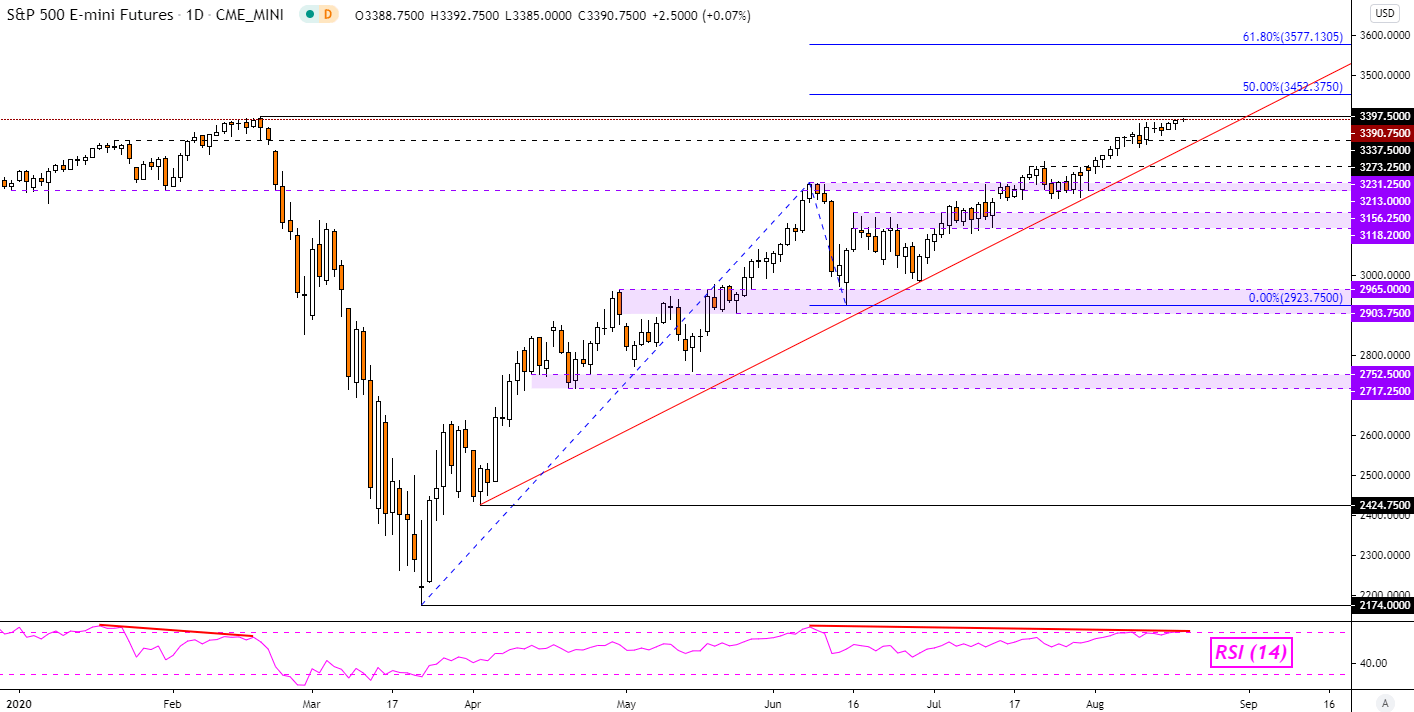
S&P 500 Chart Created in Trading View
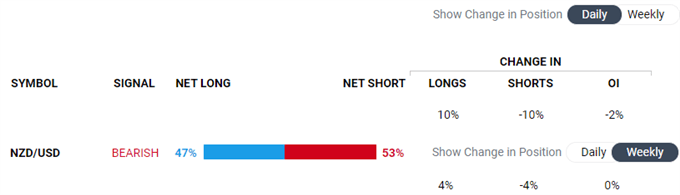
New Zealand Dollar Sentiment Outlook - Bearish
The IGCS gauge implies that roughly 47% of retail investors are net long NZD/USD. Upside exposure has increased by 10% and 4% from yesterday and last week respectively. The combination of current sentiment and recent changes offers a bearish contrarian trading bias.

New Zealand Dollar Technical Analysis
NZD/USD may turn lower after prices took out rising support from March, yet follow-through has been somewhat lacking. The 50-day Simple Moving Average caught the pair as prices bounced off the 0.6503 – 0.6537 support zone. A close under the latter could open the door to extending losses.
NZD/USD – Daily Chart

NZD/USD Chart Created in Trading View
*IG Client Sentiment Charts and Positioning Data Used from August 19th 00:05 GMT snapshot
--- Written by Daniel Dubrovsky, Currency Analyst for DailyFX.com
To contact Daniel, use the comments section below or @ddubrovskyFX on Twitter


