


US Dollar, USD/SGD, USD/IDR, USD/PHP, USD/MYR – ASEAN Technical Analysis
- USD/SGD could be readying to turn higher ahead
- USD/IDR may be readying to extend June’s bottom
- USD/PHP and USD/MYR eyeing key formations
Singapore Dollar Technical Outlook
The US Dollar could be readying to turn higher against the Singapore Dollar. USD/SGD recently formed a bullish Morning Star candlestick pattern. However, upside confirmation has been somewhat lacking as prices struggled pushing above the March low at 1.3760. Moreover, key falling resistance from the current 2020 high could maintain the dominant downtrend – red line on the daily chart below. A daily close under the 38.2% Fibonacci extension at 1.3671 opens the door to testing the 1.3558 – 1.3571 inflection range.

USD/SGD Daily Chart
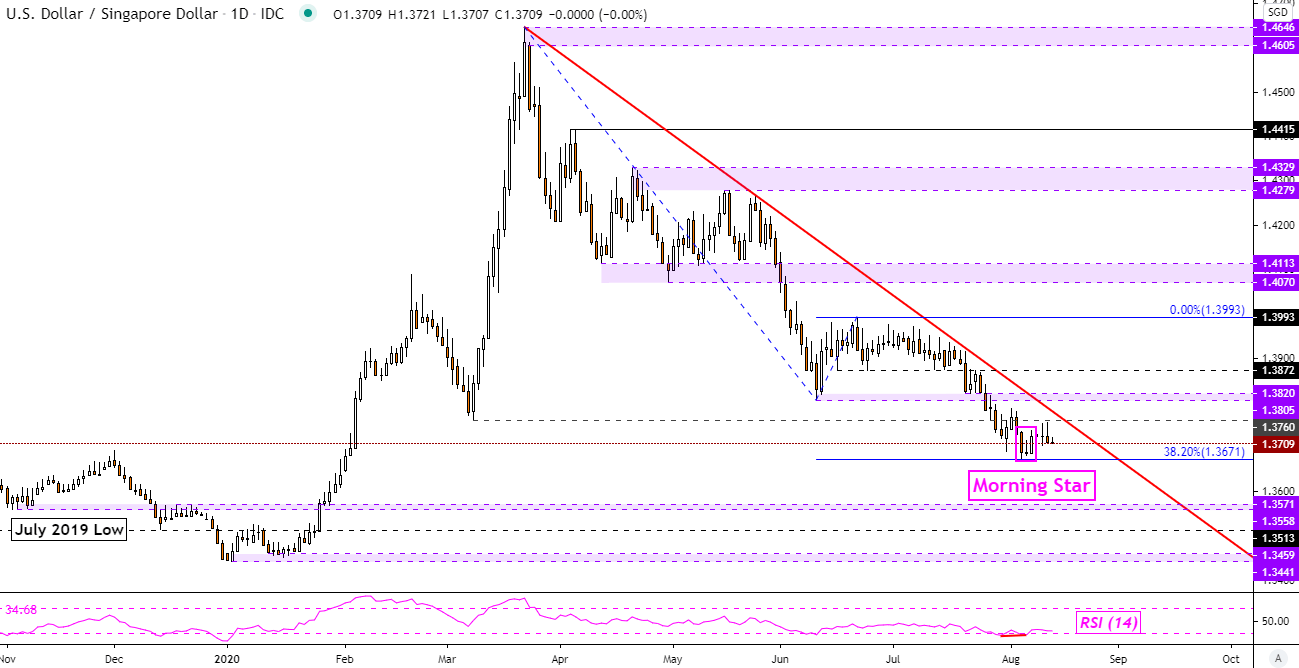
USD/SGD Chart Created in TradingView
Indonesian Rupiah Technical Outlook
The US Dollar is appearing to be back on the offensive against the Indonesian Rupiah. USD/IDR struggled to maintain a close under the short-term 20-day Simple Moving Average (SMA). Moreover, prices seem to be rising in the aftermath of a bullish ‘Golden Cross’ formation, when the 20-day SMA rose above the 50-day line. A daily close above 14827 opens the door to resuming the bounce since June, exposing former highs from 2018. Otherwise, a turn lower places the focus on 14563 towards the 50-day SMA.
For updates on ASEAN currencies as they break key technical levels, be sure to follow me on Twitter @ddubrovskyFX.
USD/IDR Daily Chart
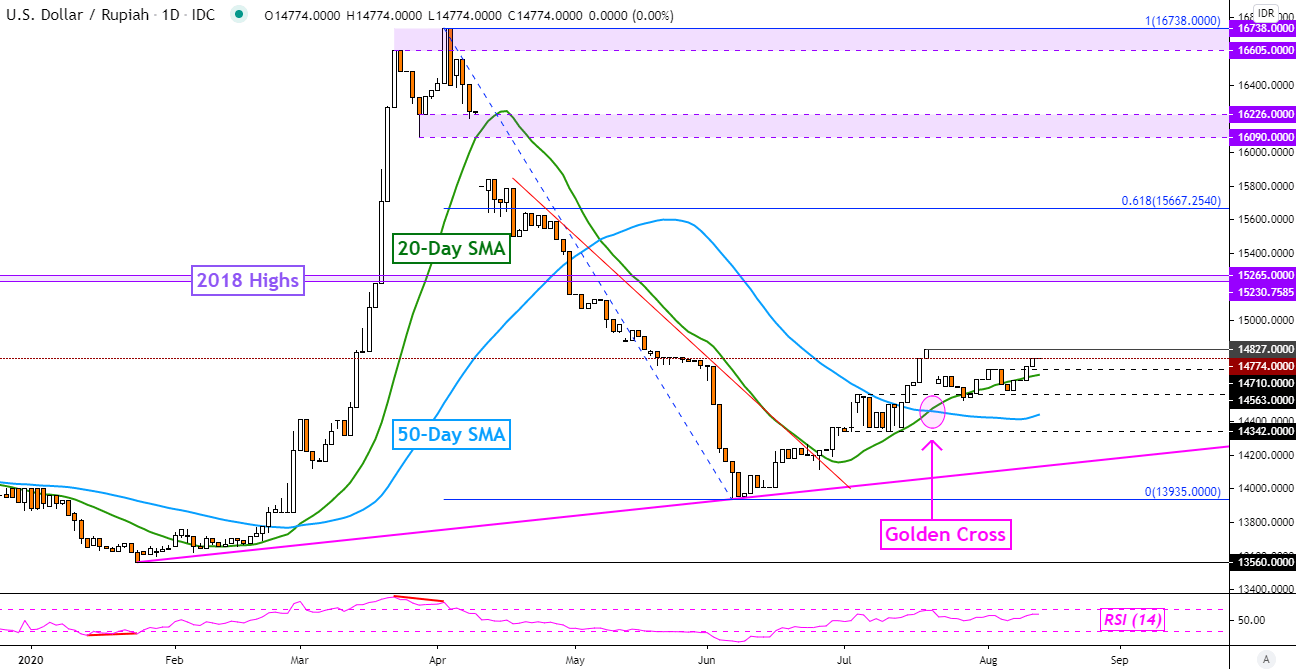
USD/IDR Chart Created in TradingView
Philippine Peso Technical Outlook
The Philippine Peso continued trading higher against the US Dollar, but USD/PHP remains within the boundaries of a bullish Falling Wedge chart pattern. Prices are now attempting to confirm a daily close under the 61.8% Fibonacci extension, which could open the door to testing former highs from October 2016. On the other hand, a daily close above the ceiling of the Falling Wedge could transition into a reversal of the dominant downtrend since March.

USD/PHP Daily Chart
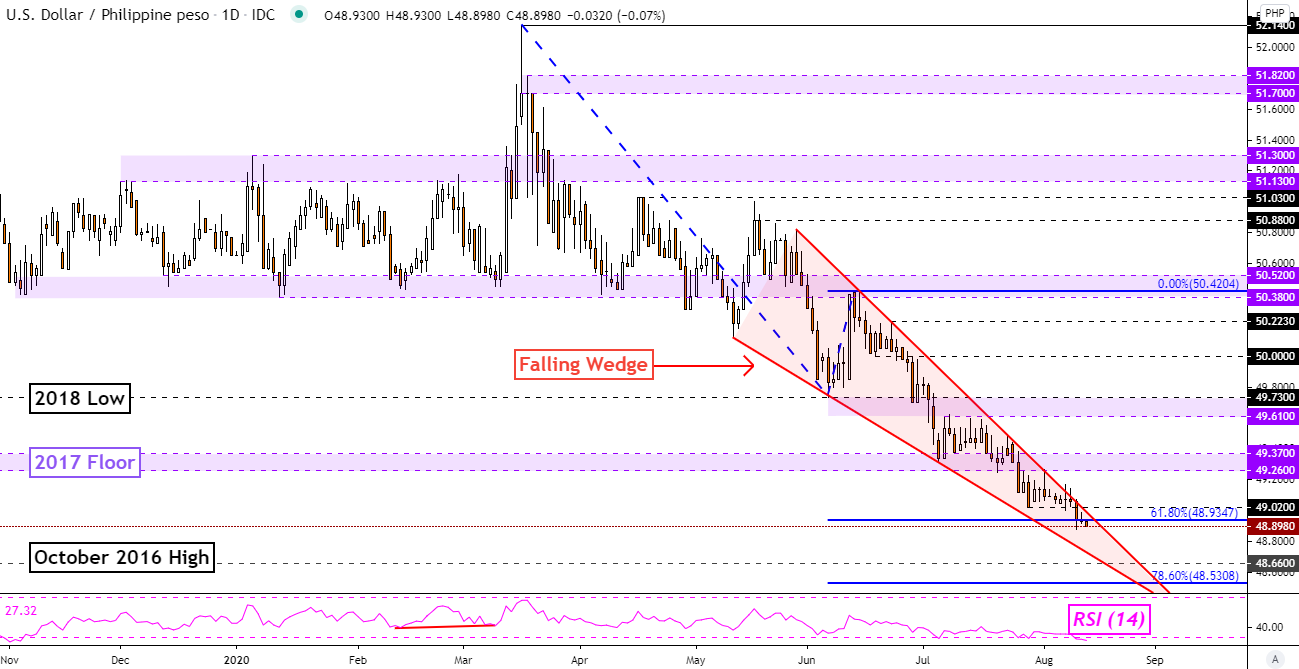
USD/PHP Chart Created in TradingView
Malaysian Ringgit Technical Outlook
The Malaysian Ringgit has lately been consolidating against the US Dollar after USD/MYR broke under a Descending Triangle chart pattern. This is typically a continuation formation which could eventually pave the way for the pair to extend its top from March towards current 2020 lows. A daily close under the midpoint of the Fibonacci extension at 4.1835 exposes the March low at 4.1600. Otherwise, immediate resistance sits above at 4.2086 which is the 38.2% Fibonacci extension.
Find your trading personality and optimal forms of analysis
USD/MYR Daily Chart
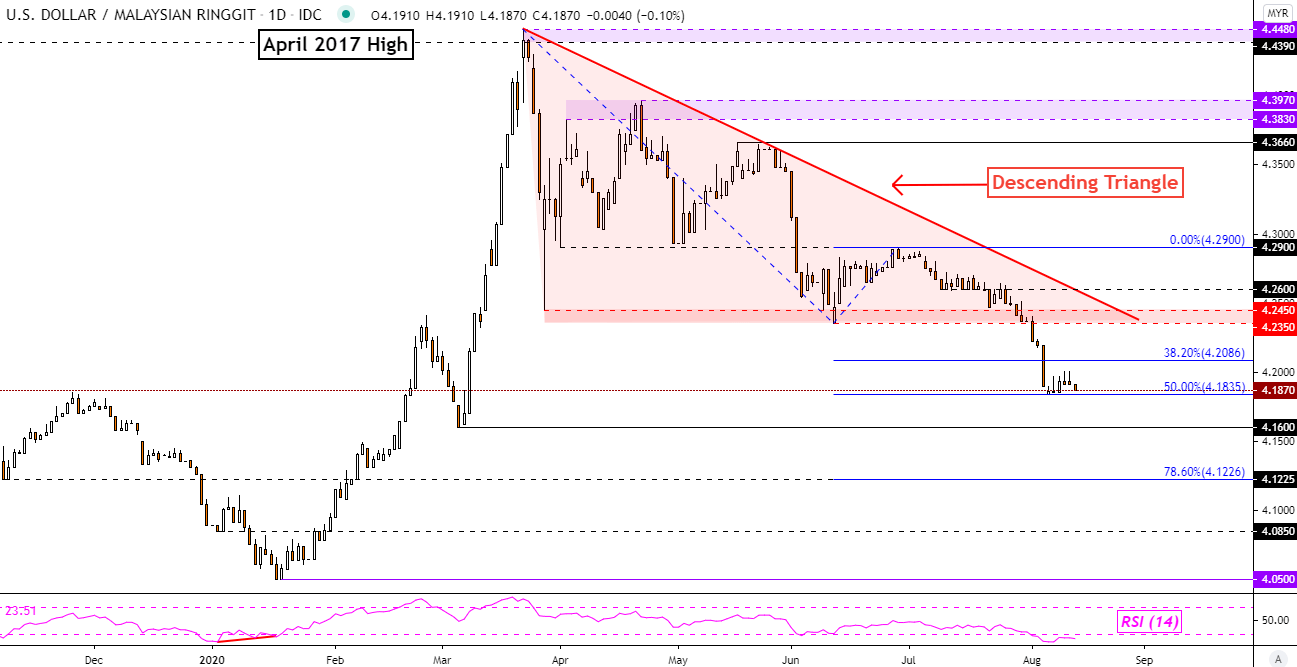
USD/MYR Chart Created in TradingView
--- Written by Daniel Dubrovsky, Currency Analyst for DailyFX.com
To contact Daniel, use the comments section below or @ddubrovskyFX on Twitter


