


S&P 500, Gold, AUD/USD, Trader Positioning - Talking Points
- IG Client Sentiment hints S&P 500 may turn lower
- Gold prices also looking shaky after bearish signals
- AUD/USD could fall as upside exposure increases
In this week’s session on IG Client Sentiment (IGCS), I discussed the outlook for the S&P 500, gold and AUD/USD. IGCS is a contrarian indicator. For a deeper dive into what this means and for fundamental analysis, check out the recording of the session above.
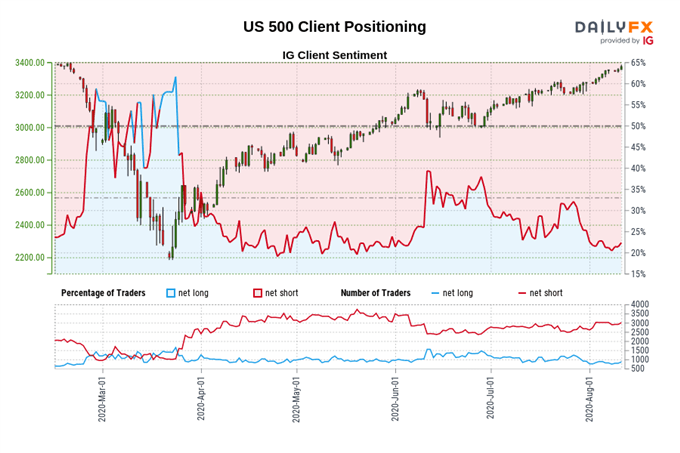
S&P 500 Sentiment Outlook - Bearish
The IGCS gauge implies that about 26% of retail traders are net long the S&P 500. Exposure to the upside has increased by 10.99% and 10.52% over a daily and weekly basis respectively. Recent changes in sentiment warn that the current price trend may soon reverse lower despite the fact traders remain netshort.
Develop the discipline and objectivity you need to improve your approach to trading consistently
S&P 500 Technical Analysis
S&P 500 futures have stopped short just under the all-time high at 3397 with prices trading around resistance at 3337. Negative RSI divergence warns that upside momentum is fading which can at times precede a turn lower. Rising support from March may however maintain the dominant uptrend if prices decline ahead.

S&P 500 Futures Daily Chart
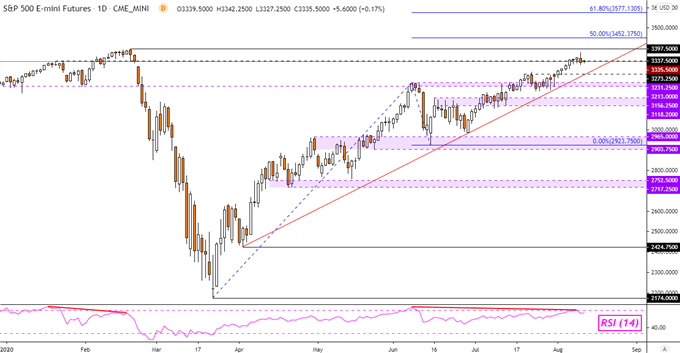
S&P 500 Chart Created in Trading View
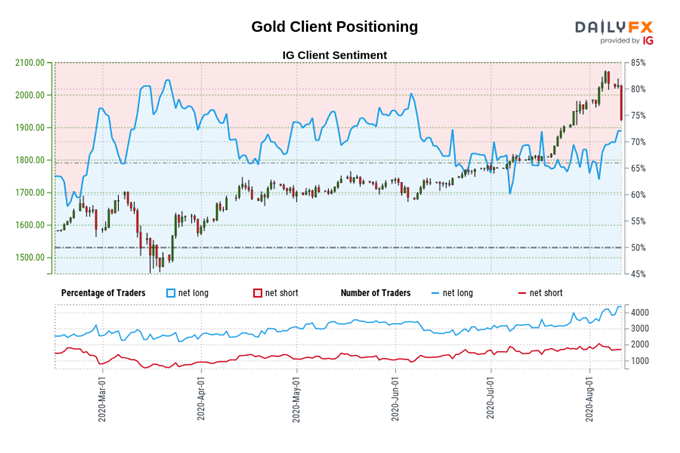
Gold Sentiment Outlook - Bearish
The IGCS gauge implies that about 74% of gold traders are net long. Net short bets have declined by 10.63% and 31.71% over a daily and weekly basis respectively. The combination of current sentiment and recent changes offers a strongerbearish contrarian trading bias.

Gold Technical Analysis
Gold prices have turned sharply lower following the emergence of a Bearish Engulfing candlestick pattern. XAU/USD took out rising support from late July. However, the dominant uptrend could still hold if rising support from June remains intact ahead. Otherwise, taking out the latter opens the door to deeper losses.
XAU/USD – Daily Chart
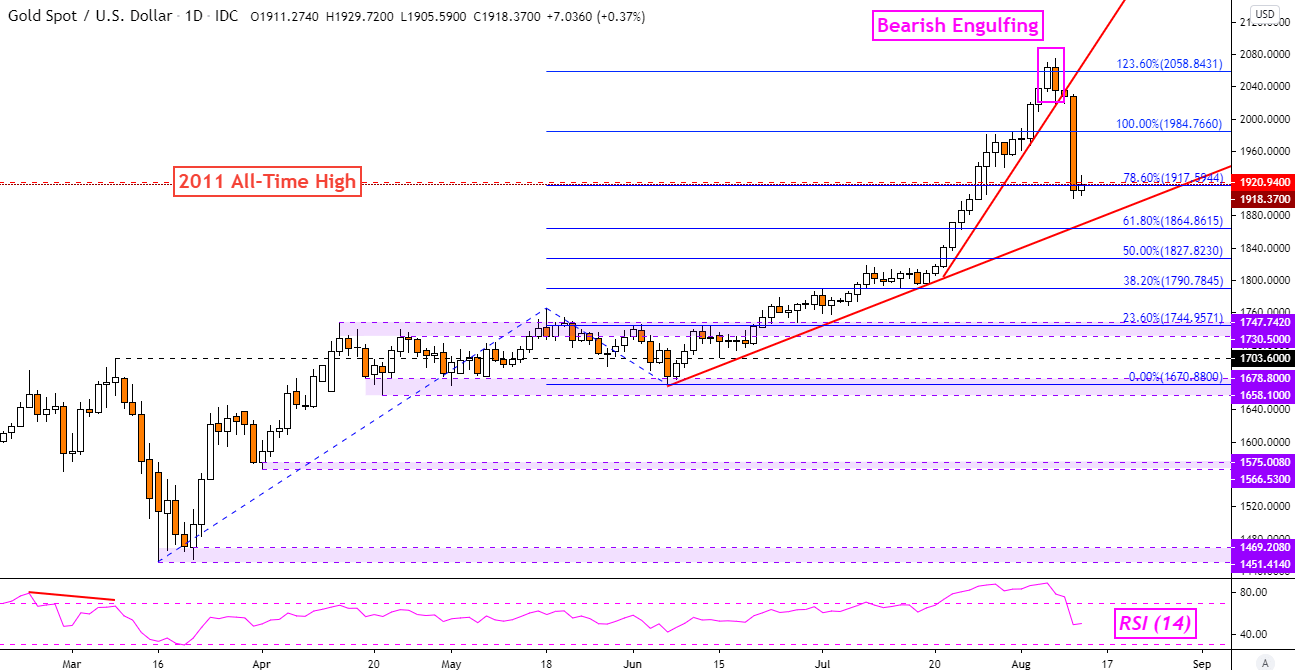
Gold Chart Created in Trading View
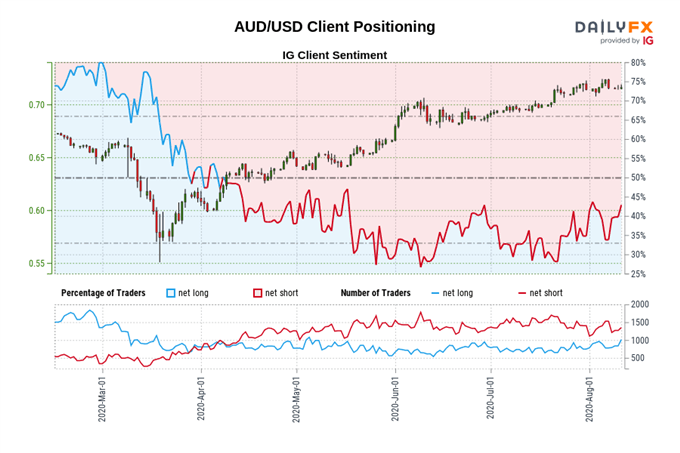
Australian Dollar Sentiment Outlook - Bearish
The IGCS gauge implies that roughly 42% of retail investors are net long AUD/USD. Upside exposure has increased by 1.63% and 7.41% from yesterday and last week respectively. Recent changes in sentiment warn that the current price trend may soon reverse lower despite the fact traders remain netshort.
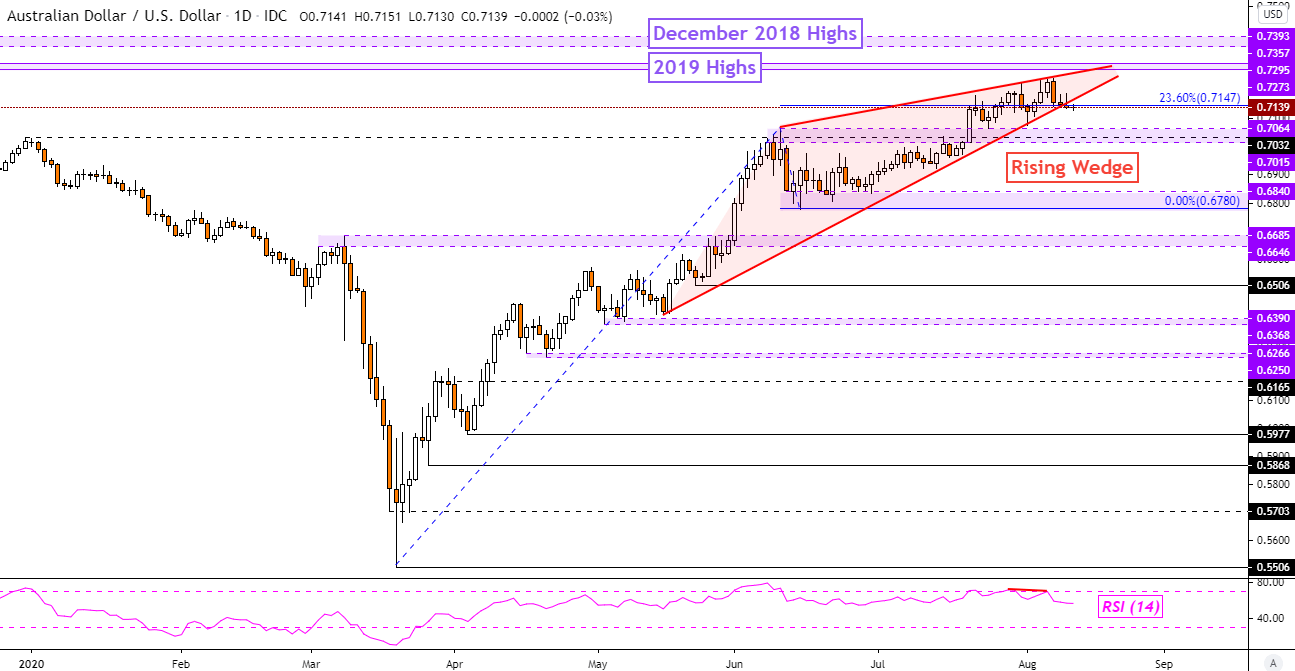
Australian Dollar Technical Analysis
AUD/USD may be at risk to turning lower as prices pressure the floor of a Rising Wedge bearish reversal chart pattern. A confirmatory downside breakout exposes the 0.7064 – 0.7015 inflection range. If this zone breaks down, the next critical barrier sits below between 0.6840 and 0.6780.
AUD/USD – Daily Chart
AUD/USD Chart Created in Trading View
*IG Client Sentiment Charts and Positioning Data Used from August 11th Report
--- Written by Daniel Dubrovsky, Currency Analyst for DailyFX.com
To contact Daniel, use the comments section below or @ddubrovskyFX on Twitter


