


USD/MXN – Eased Selling Pressure
- US Dollar sellers may comeback
- Bearish momentum remains intact
USD/MXN – Eased Selling Pressure
On Tuesday, USD/MXN tumbled to a near three-month low at 21.462 however, the price rallied after then close the weekly candlestick in the green with a 2.9% gain.
Last week, growing fears of a possible second wave of infections slowed down the US dollar selloff. This week, the U.S. Federal Reserve’s plan to kick off its corporate bond-buying program in an attempt to contain the economic damage from the coronavirus pandemic has provided the catalyst for the revival in risk appetite.
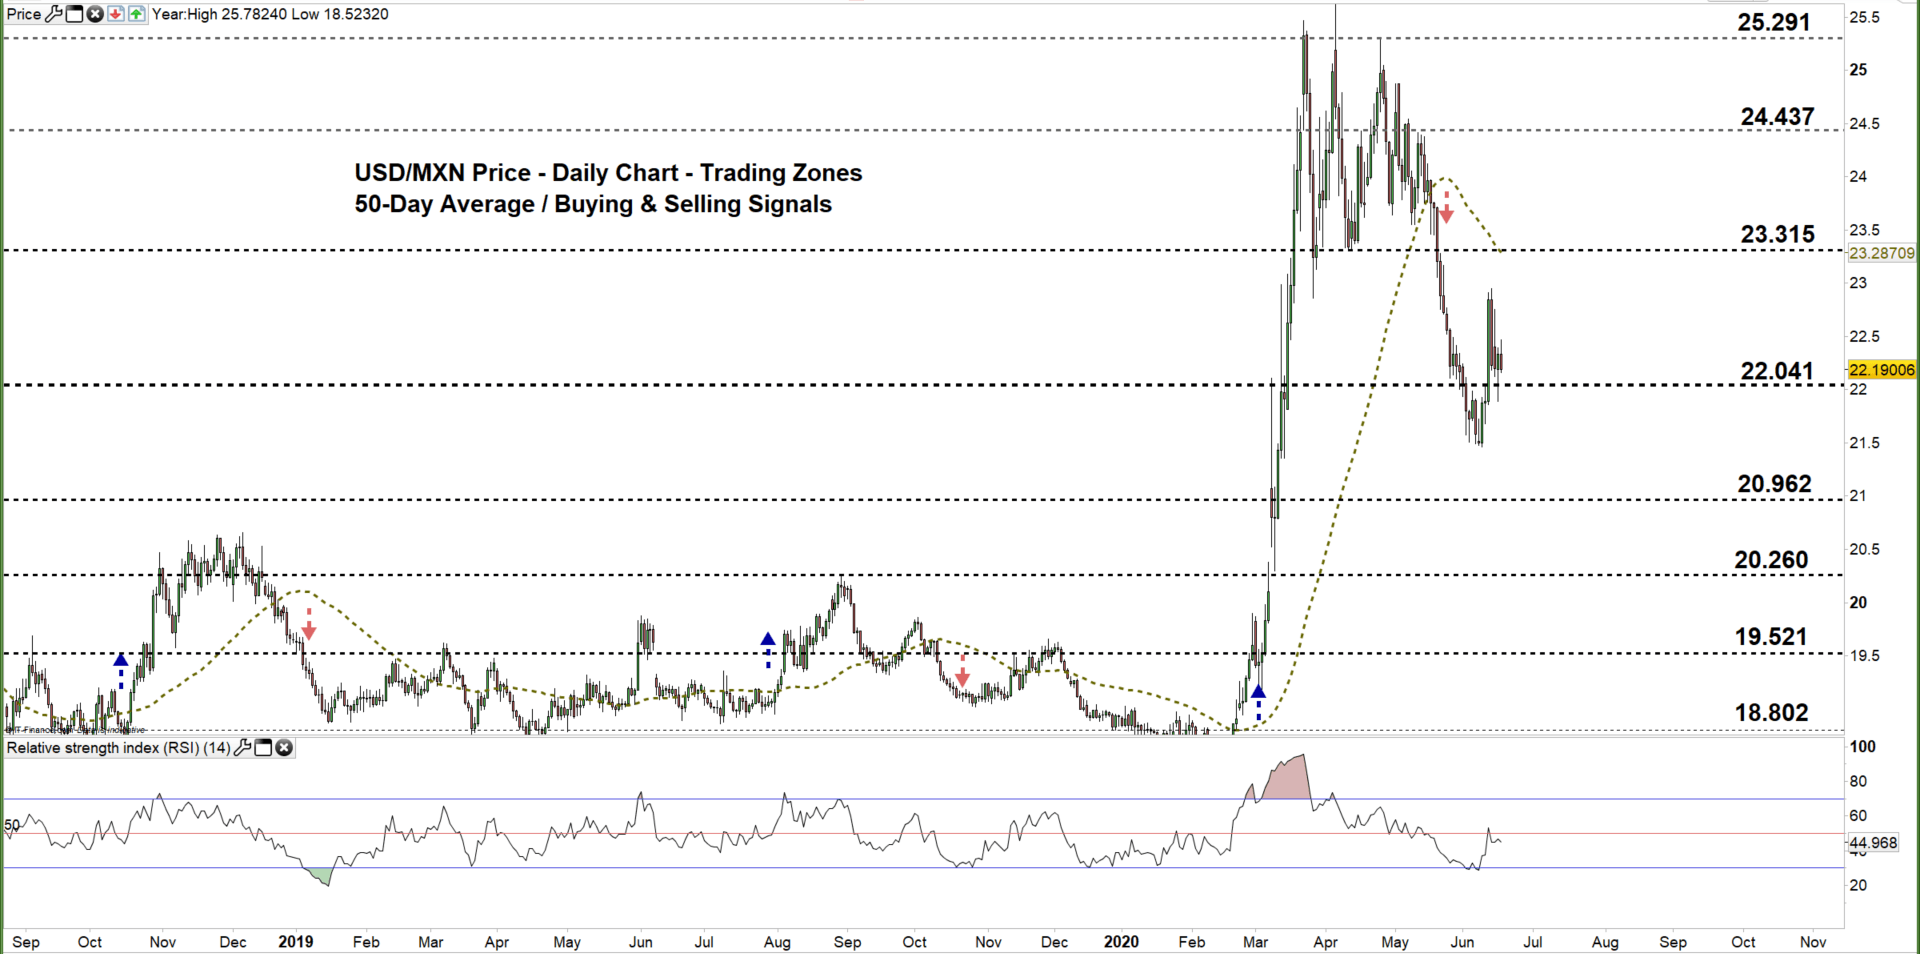
USD/MXN DAILY PRICE CHART (Sep 1, 2018 – June 17, 2020) Zoomed Out

USD/MXN DAILY PRICE CHART (Mar 19 – June 17, 2020) Zoomed In

On June 11, USD/MXN climbed to the current trading zone 22.041 – 23.315 however, the price rebounded and remained below the downtrend line originated from the April 24 high at 25.291 indicating that bulls were not ready to take charge of the price action.
A close below the low end of the zone signals that bears may re-attempt testing 20.962 then any further close below that level could send USDMXN even lower towards 20.260.
On the flip-side, if the price overtakes the aforementioned downtrend line then it could push towards the high end of the current trading zone. Any further close above that level may extend the rally towards 24.437.

USD/MXN four hour PRICE CHART (May 27 – June 17, 2020)

On June 9, USD/MXN broke above the downtrend line originated from the May 27 high at 22.489, and generated a bullish signal. However, the price has failed today to rally above the downtrend line originated from the Jun 12 high at 22.948 highlighting bull’s weakness. This could send the pair for a test of the uptrend line originated from the June 10 low at 21.679.
Therefore, a break below 21.723 could send USDMXN towards 21,088 on the other hand, any break above 22.754 may trigger a rally towards 23.134.Nonetheless, the daily support and resistance marked on the four-hour chart should be kept in focus.

Written By: Mahmoud Alkudsi
Please feel free to contact me on Twitter: @Malkudsi


