


FTSE 100 Technical Highlights:
- FTSE testing lower side of rising channel
- An important threshold for the near-term
- Stay within stay bullish, break turn bearish
FTSE testing lower side of rising channel
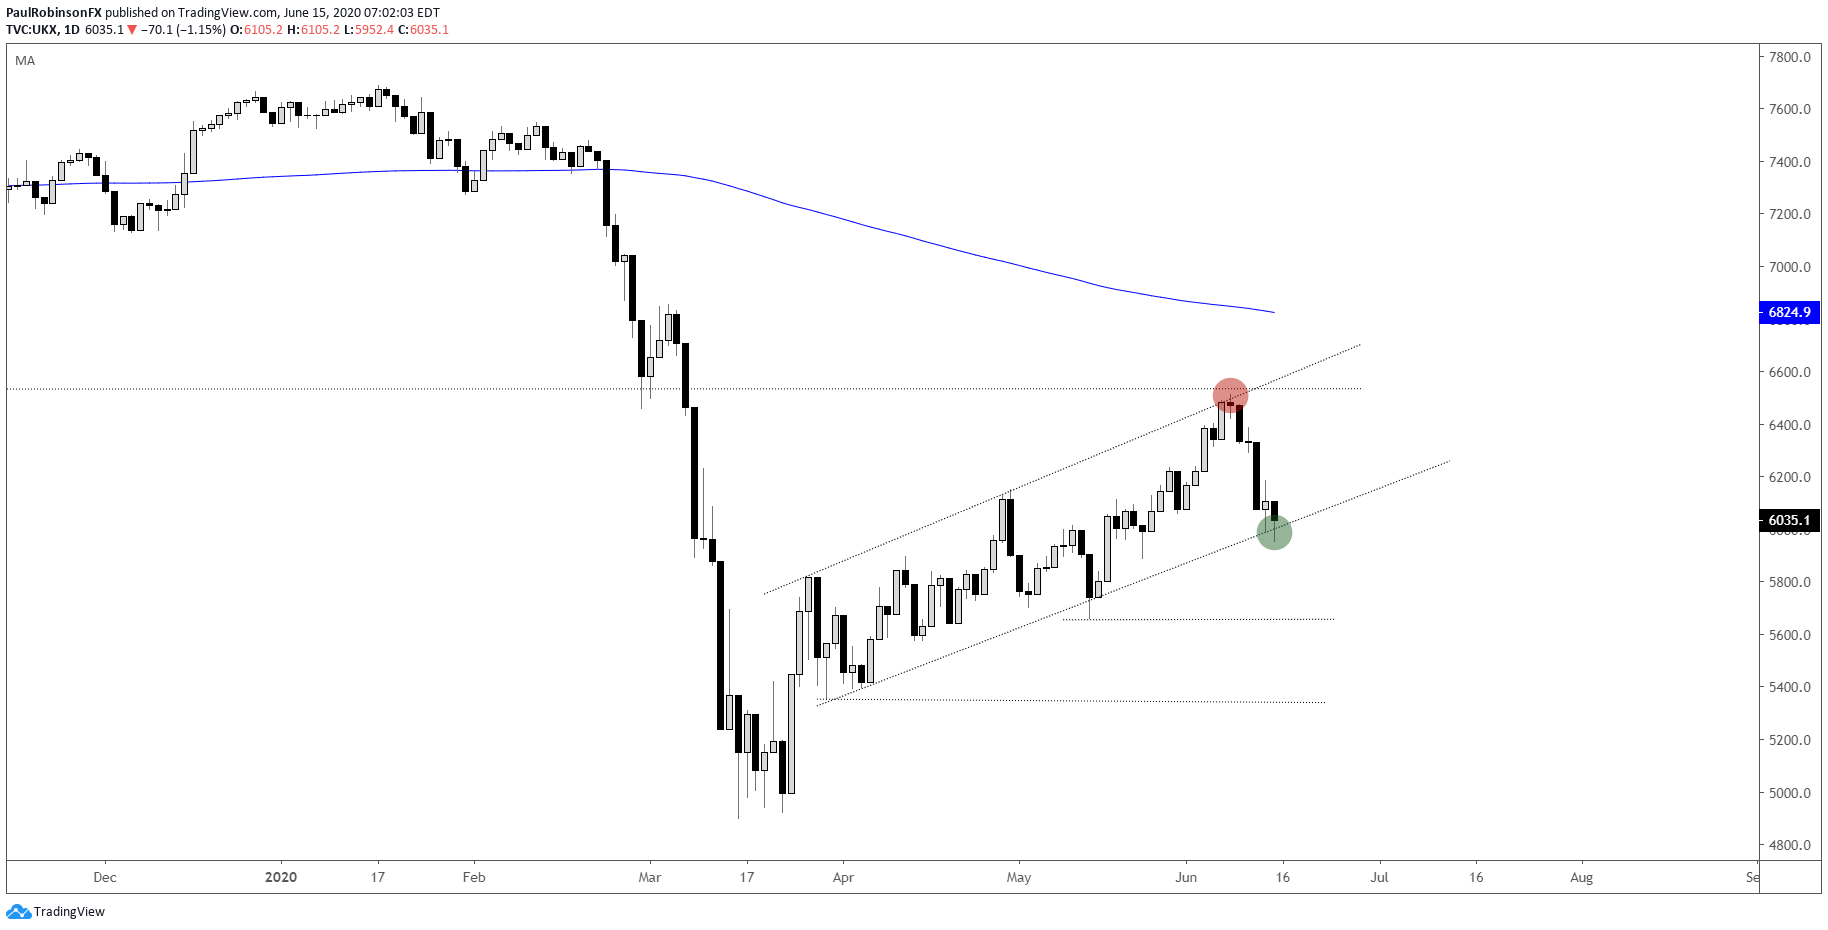
The FTSE 100 rose up and for the most part tested the important low from December 2018 and top of the bullish channel in place since March. The turn down now has the lower parallel of the channel in play as a pivotal support level for the near-term outlook.
At the moment it is support until it’s not. If the lower line can hold then the corrective-looking rally off the March low can maintain its upward structure and leave the FTSE in position to continue the upward grind.
However, a break of the parallel may usher in another leg of weakness as the sell-off becomes further entrenched in not only the UK, but also likely the rest of the globe. It will be worth paying attention to other major markets, especially the U.S. which accounts for roughly 55% of global stock market capitalization.
Should selling intensify and lead to the FTSE snapping the lower parallel the next level of support arrives via the May 14 low at 5661. Should this give-way then basically the index is in retest mode of the March panic low or worse, with 5351 next up as price support.
For now, would-be longs may be interested in using the lower parallel as a spot of entry, while would-be shorts may be best served waiting for a clean snap of support.

FTSE Daily Chart (testing lower parallel)
UK 100 Index Charts by Tradingview
You can join me every Wednesday at 930 GMT for live analysis on equity indices and commodities, and for the remaining roster of live events, check out the webinar calendar.
Tools for Forex Traders
Whether you are a beginning or experienced trader, DailyFX has several resources available to help you; indicator for tracking trader sentiment, quarterly trading forecasts, analytical and educational webinars held daily, trading guides to help you improve trading performance, and one specifically for those who are new to forex.
---Written by Paul Robinson, Market Analyst
You can follow Paul on Twitter at @PaulRobinsonFX


