


British Pound, GBP/CAD, GBP/AUD, GBP/CHF - Technical Forecast
- British Pound technical view seems to favor downside
- GBP/CAD may pressure rising support from August
- GBP/AUD downtrend extends, GBP/CHF could fall
British Pound Technical Analysis
Taking a look at my majors-based British Pound index, which averages GBP against EUR, JPY, AUD and USD, Sterling has generally been idling for almost 3 weeks. On the whole, it still finds itself in a downward bias since prices closed under key rising support from August 2019 – blue lines on the daily chart below. The falling trend line from March – pink line – seems to be guiding GBP lower. Taking out immediate support below (0.1102 – 0.1106) could open the door to general Sterling selling pressure from a technical view.
Majors-Based GBP Index – Daily Chart
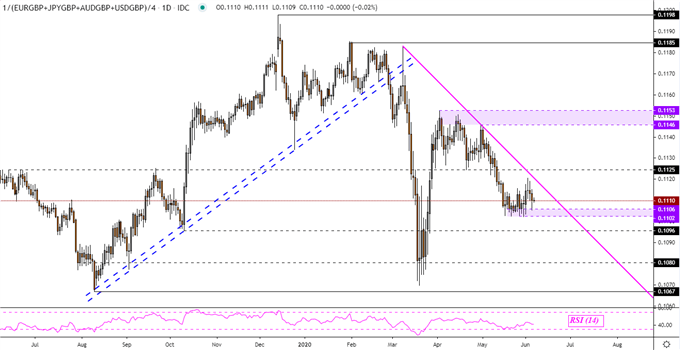
*Majors-Based GBP Index Averages Sterling Versus EUR, JPY, AUD and USD
GBP/CAD Technical Outlook
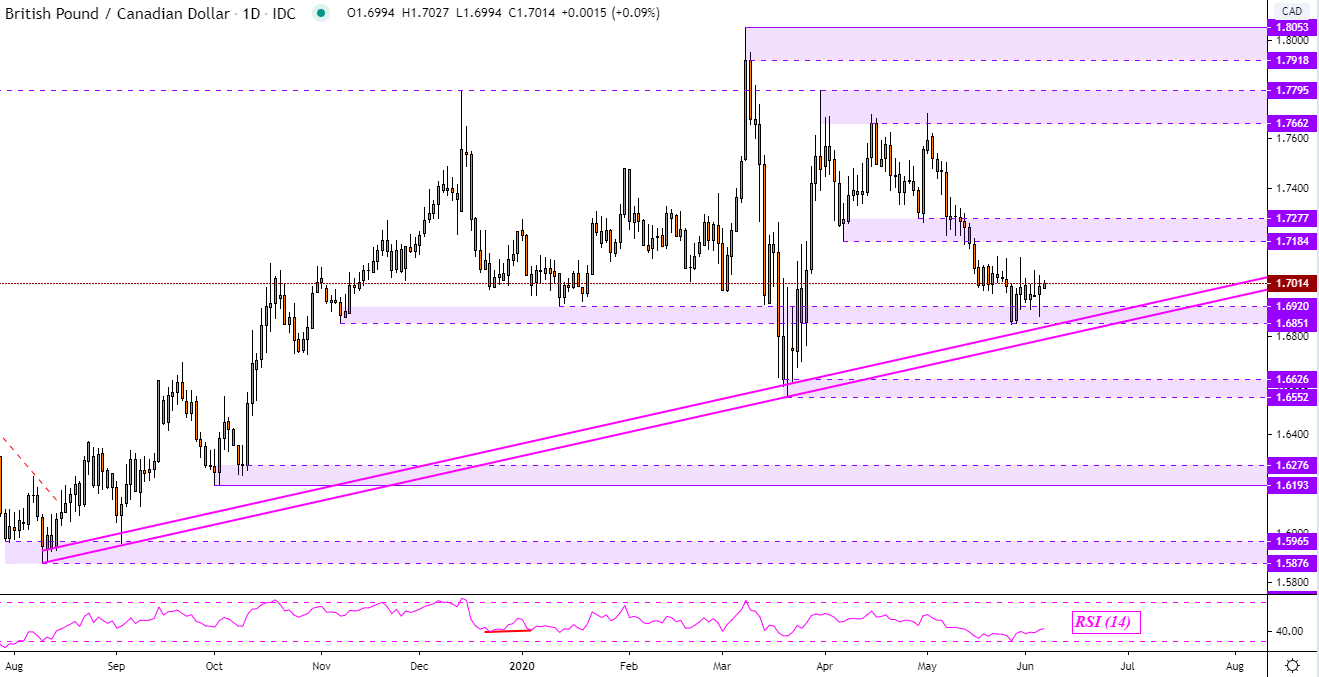
Despite recent selling pressure, GBP/CAD remains in a dominant uptrend as prices test the 1.6851 – 1.6920 inflection point on the daily chart below. Rising support from August has been offering an upside tilt that still hold – pink lines. As such, GBP/CAD could be at a turning point here if these two technical barriers holds. That may open the door to revisiting former support which could stand in the way as new resistance between 1.7184 – 1.7277. Otherwise, taking out rising support exposes lows from March.
What are some unique aspects of trading forex?
GBP/CAD - Daily Chart
GBP/AUD Technical Outlook
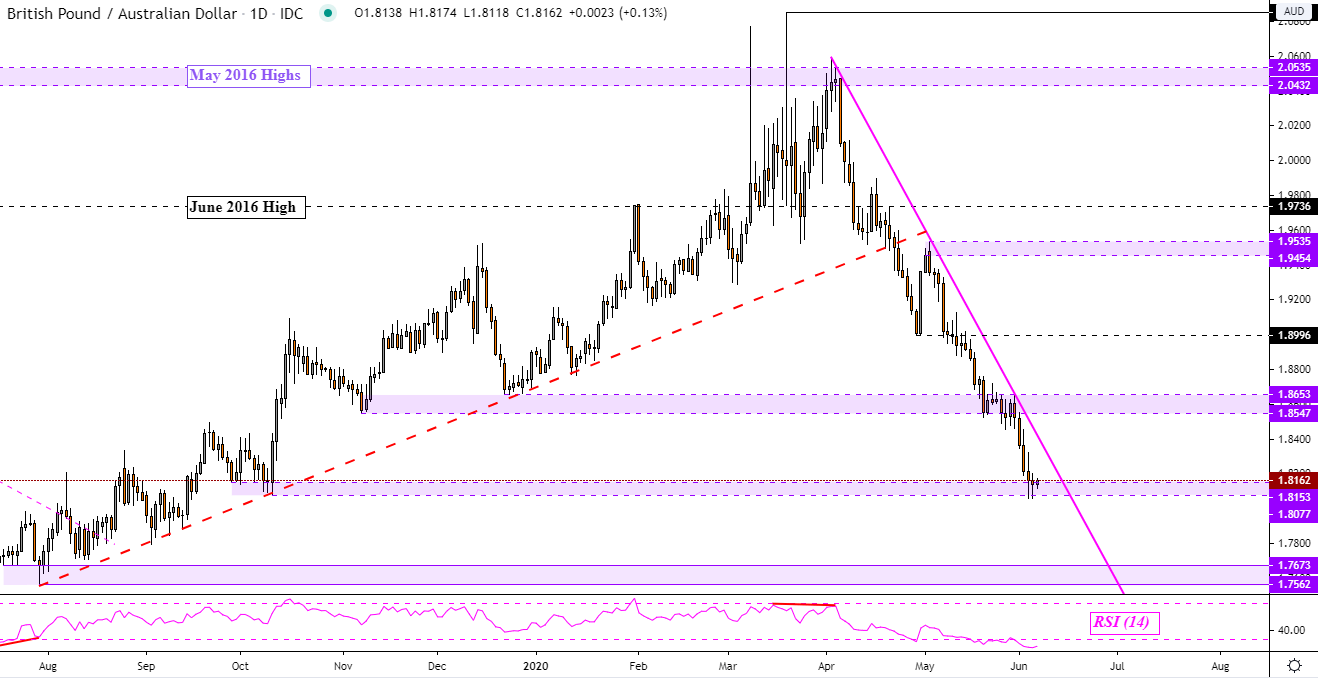
The dominant downside tilt in GBP/AUD remains after the pair extended its selloff after closing under rising support from late July – red line. Now the pair is testing the next formidable support area between 1.8077 – 1.8153. If this range holds, it may push the pair to pressure the falling trend line from the March top – pink line. That may reinstate the downside focus. Further losses would expose 2019 lows which would make for a range of support between 1.7562 – 1.7673. Otherwise, a turn higher opens the door to testing 1.8547 – 1.8653.

GBP/AUD – Daily Chart
GBP/CHF Technical Outlook
GBP/CHF remains in a consolidative mode since April, with the pair seemingly rejecting key resistance between 1.2144 – 1.2205. A turn lower from here places the focus on the 1.1875 – 1.1917 inflection range towards 1.1672 – 1.1725. The latter area could open the door for another bounce which would prolong the consolidative setting. If not, then that falling further would expose March lows (1.1118 – 1.1200). Pushing above resistance opens the door to potentially revisiting January lows around 1.2530.
GBP/CHF - Daily Chart

--- Written by Daniel Dubrovsky, Currency Analyst for DailyFX.com
To contact Daniel, use the comments section below or @ddubrovskyFX on Twitter


