


USD vs MXN Technical Forecast
- USD vs MXN chart exposes a sideways move
- Key levels and signals to consider
USD/MXN – Bears Pullback
On Friday, USD/MXN declined to an over three-week low at 23.551 then rallied after as some bears seemed to cover. Yet, the market closed the weekly candlestick in the red with a 3.8% loss. This week bears have eased up even more allowing the price to rally further.
This week, the Relative Strength Index (RSI) has crossed 50 highlighting a possible bullish comeback.
USD/MXN DAILY PRICE CHART (Sep 1, 2018 –May 13, 2020) Zoomed Out


USD/MXN DAILY PRICE CHART (Mar 10 – May 13, 2020) Zoomed In
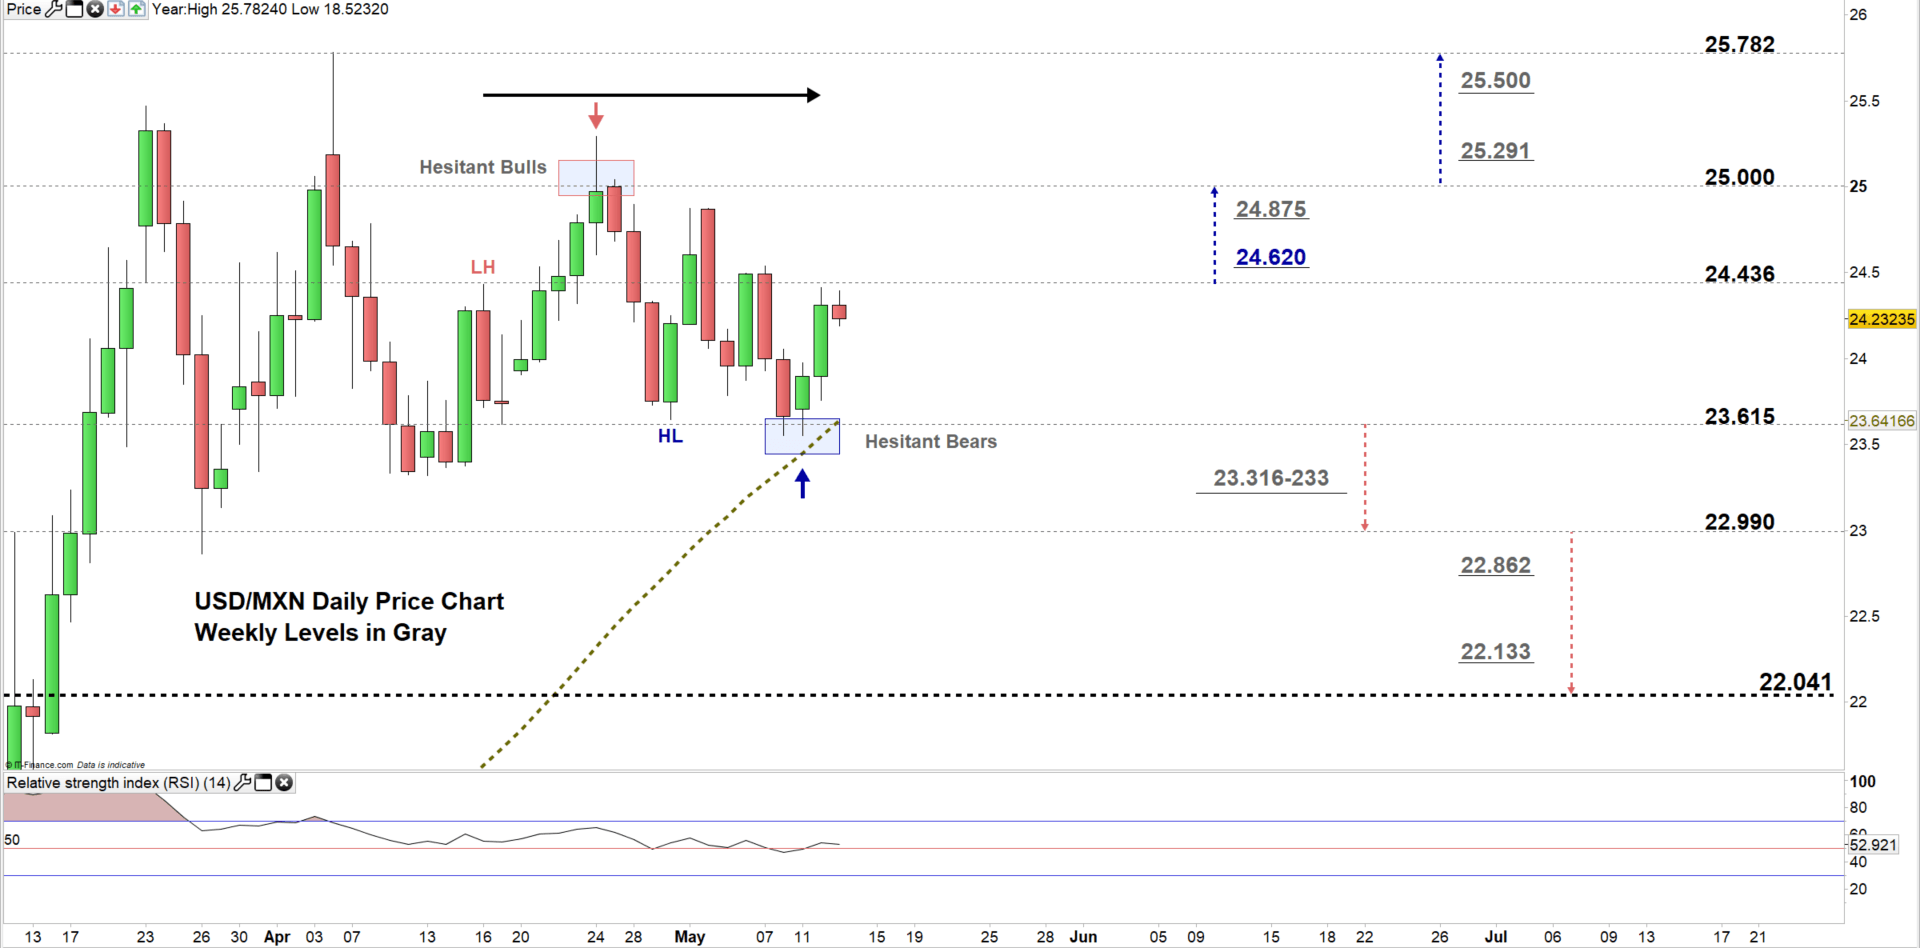
Based on analysis of the daily chart, on April 6 USD/MXN took off to all-time high at 25.782. Afterward, the price corrected its uptrend then traded in a sideways move creating lower highs with higher lows. On Thursday the pair declined to the current trading zone 23.615 -24.436 then failed twice to move to the lower zone reflecting bear’s reluctance.
A close above the high end of the zone may trigger a rally towards 25.000. A further close above this level could extend this rally towards the aforementioned all-time high. In that scenario, the daily and weekly resistance levels underscored on the chart (zoomed in) should be considered.
On the flip-side, a close below the low end of the zone could send USDMXN towards 22.990. A further close below that level may cause more bearishness towards 22.041. That being said, the weekly support area and levels marked on the chart should be kept in focus.

USD/MXN four hour PRICE CHART (April 27 – May 13, 2020)

Looking at the four- hour chart, yesterday USD/MXN broke above the downtrend line originated from the May 4 high at 24.875 generating a bullish signal.
A break above 24.542 would be considered another bullish signal and increases the likelihood of USDMXN trading towards 24.682. Nevertheless, the weekly resistance level underlined on the chart should be watched closely. In turn, a break in the other direction i.e. below 23.550 could press the pair towards 23.318. Although, the support level at 23.488 should be monitored.
See the chart to figure out more about key levels to monitor in a further bullish/bearish move.

Written By: Mahmoud Alkudsi
Please feel free to contact me on Twitter: @Malkudsi


