


US Dollar, USD/SGD, USD/MYR, USD/IDR, USD/PHP – ASEAN Technical Analysis
- US Dollar upside breakout against ASEAN FX steadied
- USD/SGD established key resistance as USD/MYR fell
- USD/IDR broke under support, USD/PHP consolidated
Singapore Dollar, Malaysian Ringgit, Indonesian Rupiah, Philippine Peso Technical Outlook
The US Dollar cautiously rose against some of its ASEAN counterparts since I last discussed the technical outlook – as expected. Below is my ASEAN-based US Dollar index – which averages USD against SGD, MYR, IDR and PHP – and gains extended after prices broke above falling resistance from last month’s top – blue line. Guiding the USD higher ahead could be rising support from early March. Resuming the uptrend entails taking out 4.2370 which would expose current April peaks.

ASEAN-Based US Dollar Index – Daily Chart
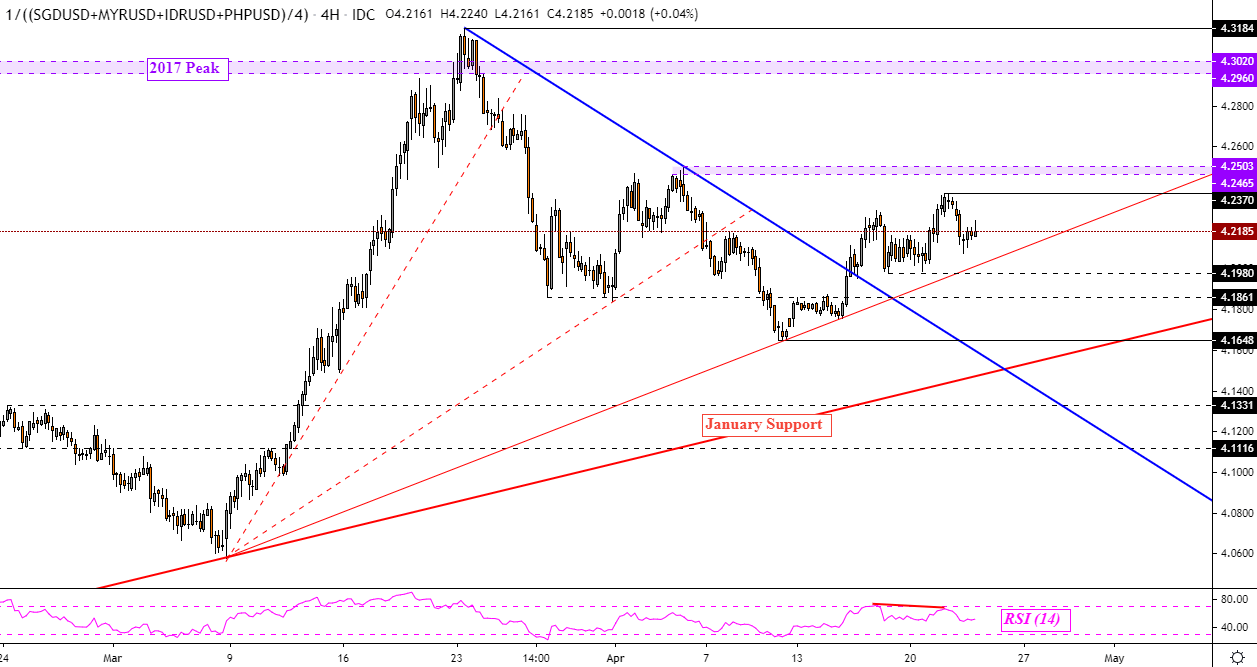
ASEAN Chart Created in TradingView
Singapore Dollar Technical Outlook
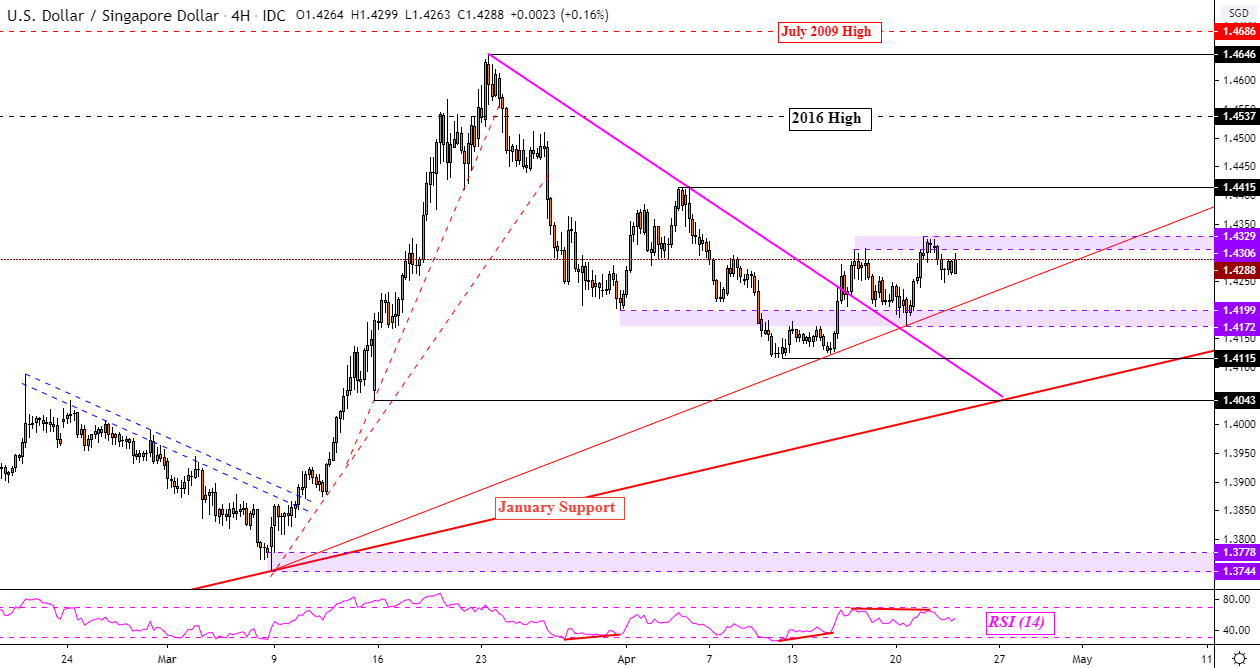
The Singapore Dollar recently rejected resistance at 1.4329 after negative RSI divergence emerged. The latter is a sign of fading upside momentum. That could pave the way for USD/SGD to test rising support from early March. This line could hold and maintain the near term upward bias after prices closed and confirmed a push above falling resistance from last month – pink line. A close above 1.4329 exposes 1.4415 towards 1.4537 which is also the high from April 2016. Resuming the prior downtrend entails taking out 1.4115.
Learn more about how the MAS conducts monetary policy and what matters for the Singapore Dollar !
USD/SGD 4-Hour Chart

USD/SGD Chart Created in TradingView
Malaysian Ringgit Technical Outlook
The US Dollar extended gains against the Malaysian Ringgit after taking out falling resistance from March. Since then, USD/MYR struggled to push higher as a range of resistance formed between 4.3830 to 4.3970. Rising support “1” is in focus. If it is taken out, that may shift the near term bias lower. That exposes key support at 4.2985 to 4.3085. Beyond that also sits rising support “2” which may uphold the dominant upward trajectory. Resuming gains may eventually pave the way to revisit 4.4390.
USD/MYR Daily Chart
USD/MYR Chart Created in TradingView
Indonesian Rupiah Technical Outlook
The Indonesian Rupiah closed under rising support “2” on the USD/IDR 4-hour chart below. This follows taking out support “1” after topping last month at 16737. Downside progress was slowed at the 61.8% Fibonacci retracement at 15524. Taking out this price opens the door to revisiting highs from 2018 which may come back in play as support between 15230 to 15265. In the event of deeper declines, rising support “3” could keep downside pressure at bay. A turn higher places the focus on the 78.6% retracement at 16057.
To stay updated on fundamental developments for ASEAN currencies, follow me on Twitter here @ddubrovskyFX
USD/IDR Daily Chart
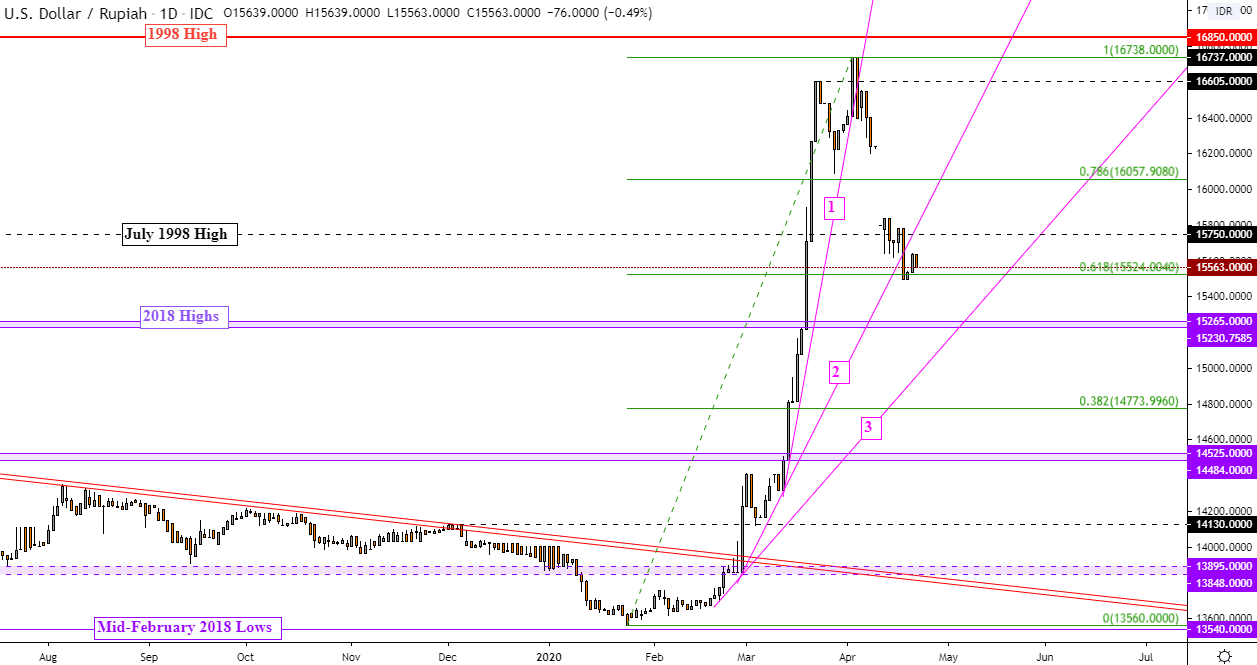
USD/IDR Chart Created in TradingView
Philippine Peso Technical Outlook
The Philippine Peso broke above a Falling Wedge bullish chart pattern. Yet USD/PHP struggled to find upside follow-through. The pair appears to now be aiming back towards the lower boundary of its persistent consolidation since November. This is a range of support between 50.38 to 50.52. If it holds, a bounce could place the focus back again to the outer boundary of congestive resistance at 51.13 to 51.30. A break lower exposes the 78.6% Fibonacci extension at 50.2536 while a push above resistance exposes 51.82.

USD/PHP Daily Chart
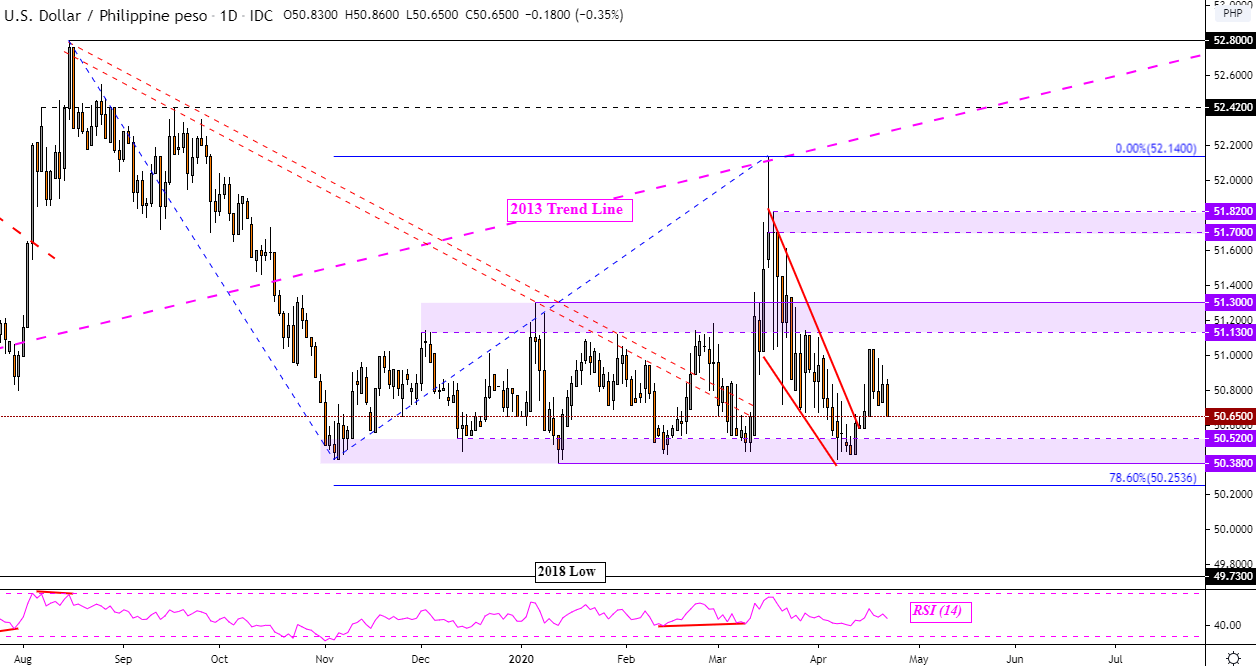
USD/PHP Chart Created in TradingView
--- Written by Daniel Dubrovsky, Currency Analyst for DailyFX.com
To contact Daniel, use the comments section below or @ddubrovskyFX on Twitter


