


USD vs MXN Technical Forecast
- Bulls in charge
- Levels and trading zones to consider
USD/MXN – Bullish Development
On Thursday, USD/MXN rallied to 24.432 then retreated and settled below 24.000 handle. Yet, the price closed on Friday the weekly candlestick with nearly 1.7% gain. This week, the pair has opened with a gap to the upside, reflecting the bullish outlook of the market.
The Relative Strength Index (RSI) crept from 56 to 60 highlighting ongoing uptrend move.
USD/MXN DAILY PRICE CHART (Mar 1, 2019 – Apr 22, 2020) Zoomed Out


USD/MXN DAILY PRICE CHART (Mar 10 – Apr 22, 2020) Zoomed In
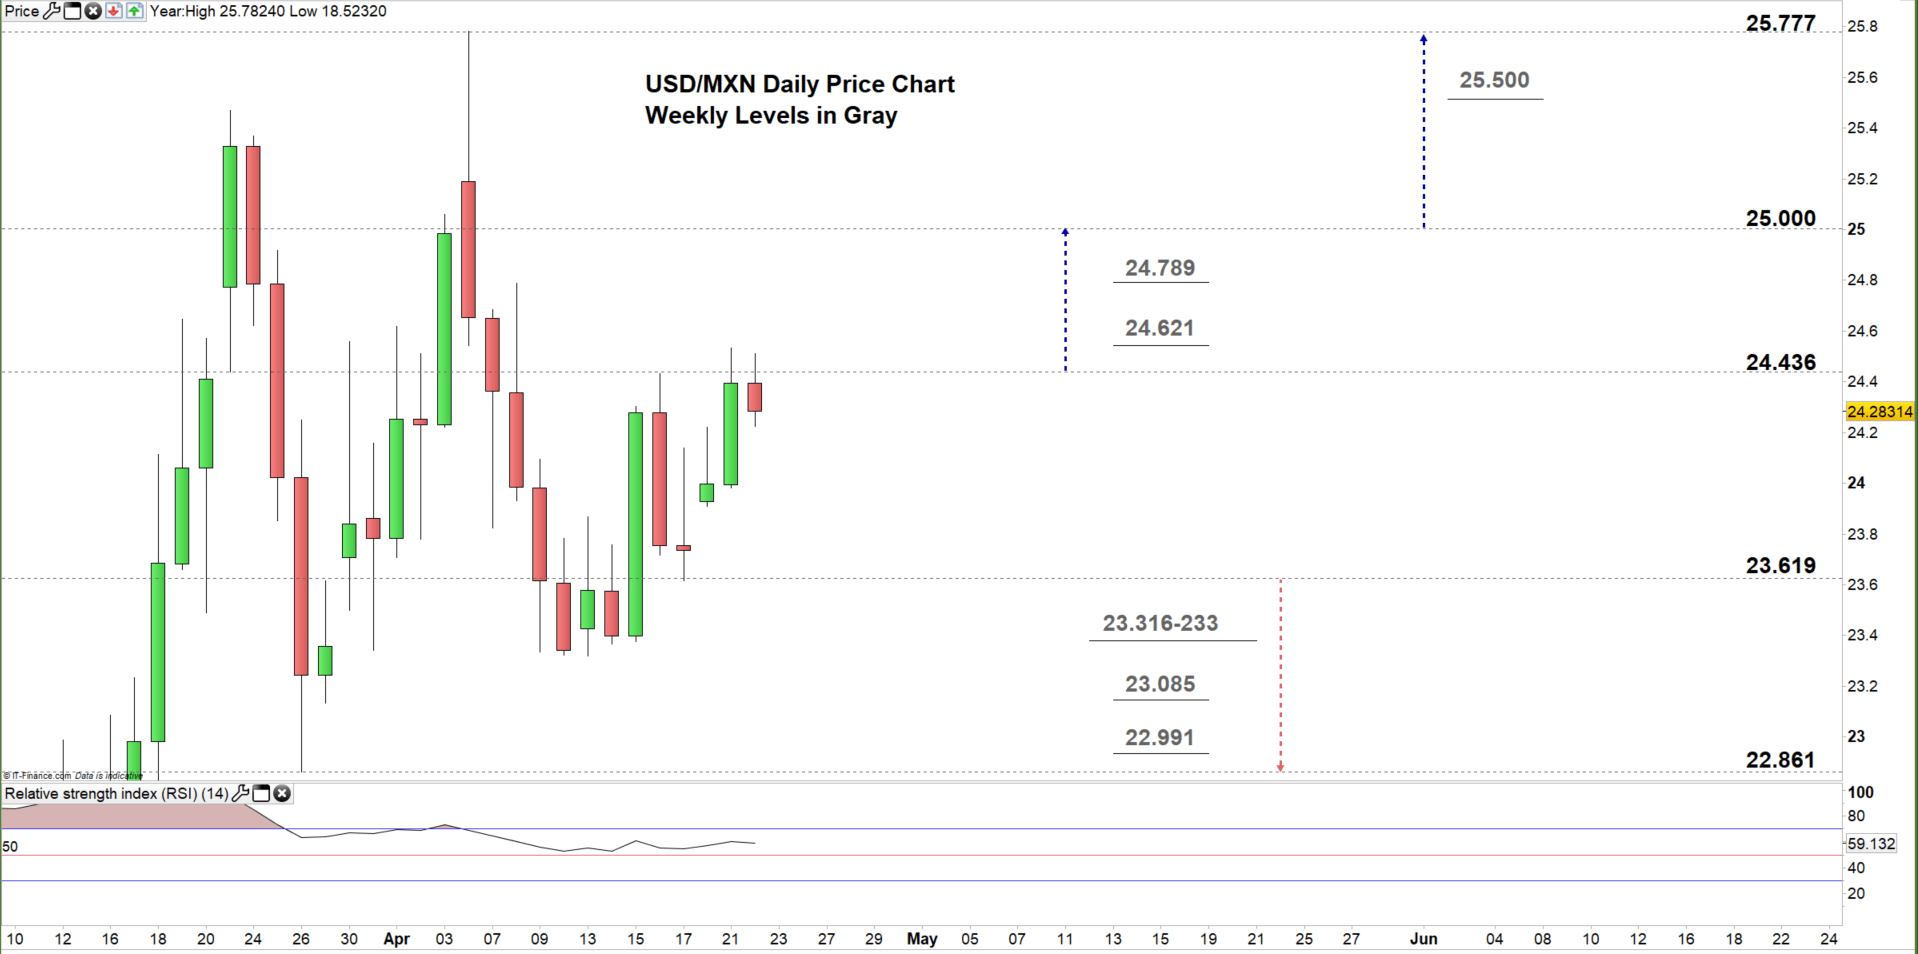
From the daily chart, we noticed that on Wednesday USD/MXN climbed and remained moving in the current trading zone 23.619 – 24.436. On Friday, the price rebounded from the low end of the zone then rallied after eyeing a test of the high end of it.
Any close above the high end of the zone may cause a rally towards 25.000 threshold. Further close above that level could extend this rally towards the April 6 high at 25.777. Yet, the weekly resistance levels underlined on the chart (zoomed in) should be considered.
On the flip side, another failure in closing above the high end of the zone could reverse the pair’s direction towards the low end of the zone. Further close below that level, may send USDMXN even lower towards 22.861. In that scenario, the daily and weekly support levels and area marked on the chart should be monitored.

USD/MXN four hour PRICE CHART (Mar 2 – Apr 22, 2020)
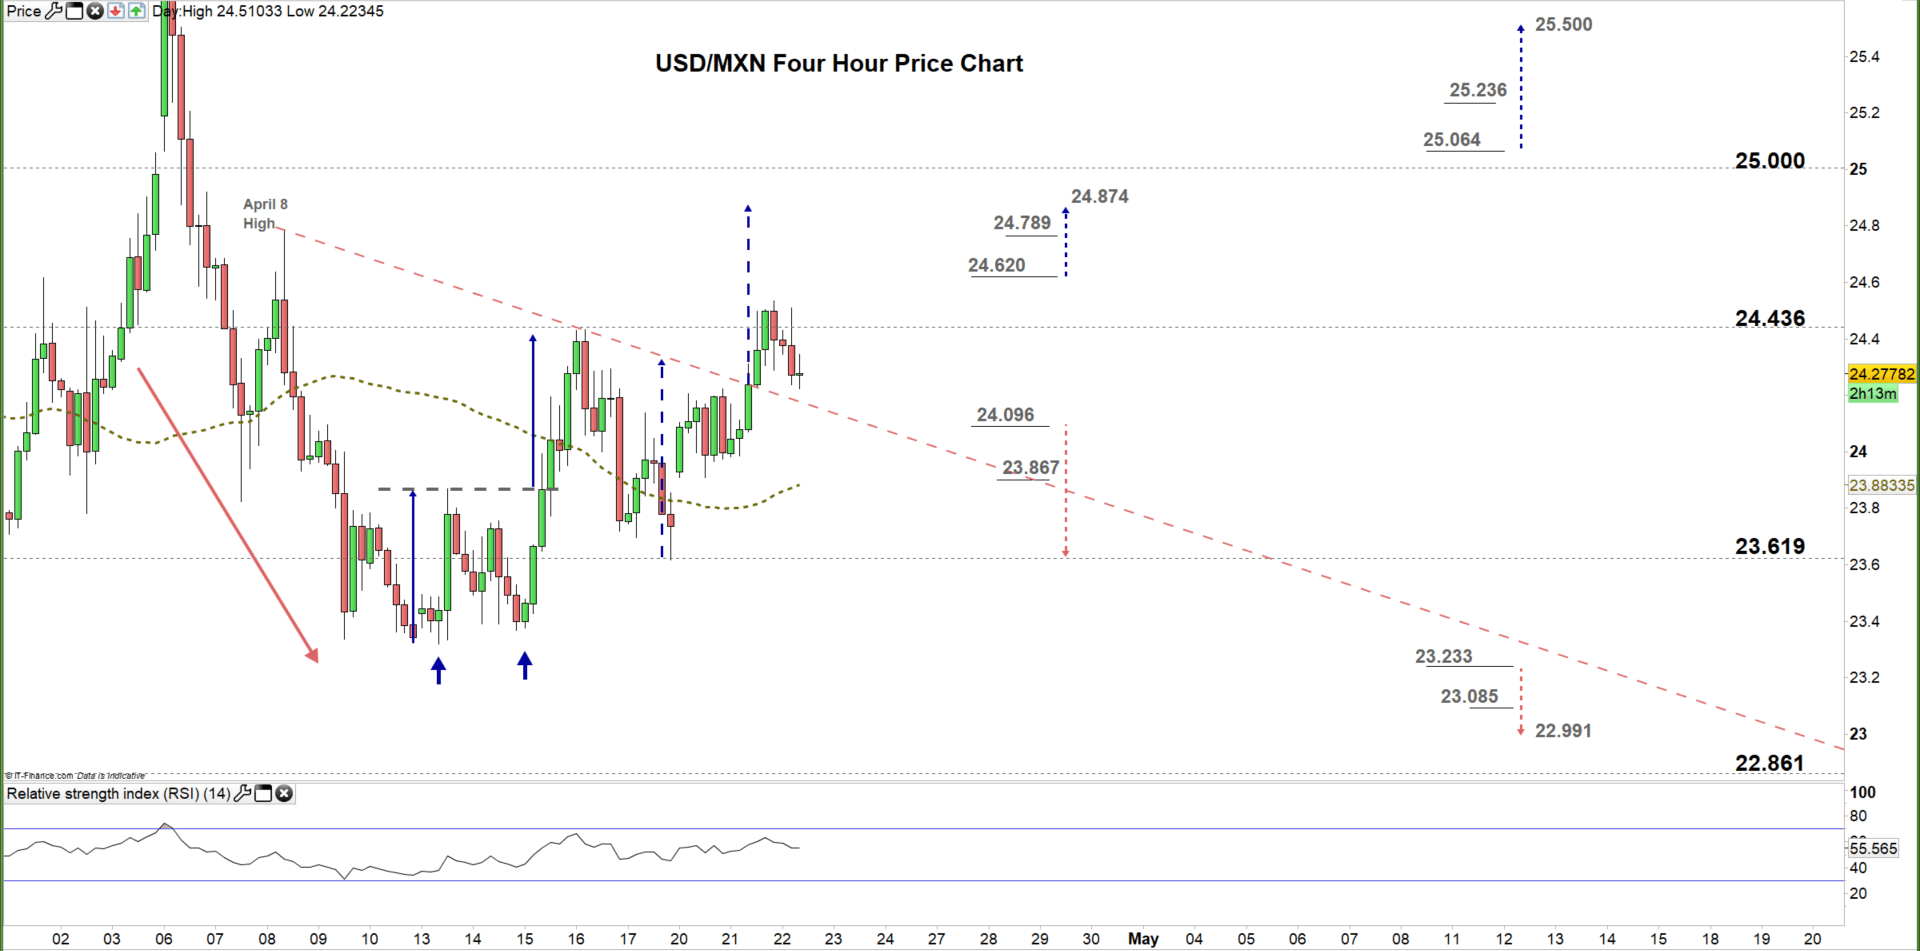
Looking at the four- hour chart, we notice that on April 15 USD/MXN reversed its downtrend move as broke above the neckline of the double bottom line residing at 23.867. Yesterday, the price rallied above the downtrend line originated from the April 8 high at 24.788 generating a bullish signal.
A break above 24.620 would be considered a bullish signal. This increases the likelihood of rallying towards 24.874. That said, the weekly resistance level underscored on the chart should be kept in focus. In turn, any break in the other direction i.e. below 24.096 could send USDMXN towards the low end of the current trading zone discussed above on the daily chart.
See the chart to figure out more about key levels to monitor in a further bullish/bearish move.

Written By: Mahmoud Alkudsi
Please feel free to contact me on Twitter: @Malkudsi


