


USD vs MXN Technical outlook
- Will bulls give up control ?
- Levels and signals to monitor
USD/MXN – Weaker Bullish Move
Last week, USD/MXN reversed higher and recovered majority of previous week loss. On Friday, the price closed the weekly candlestick in the green with nearly 7% gain.
This week, the Relative Strength Index (RSI) has abandoned overbought territory. If the oscillator falls below 63 then this would be considered as a failure swing signal.
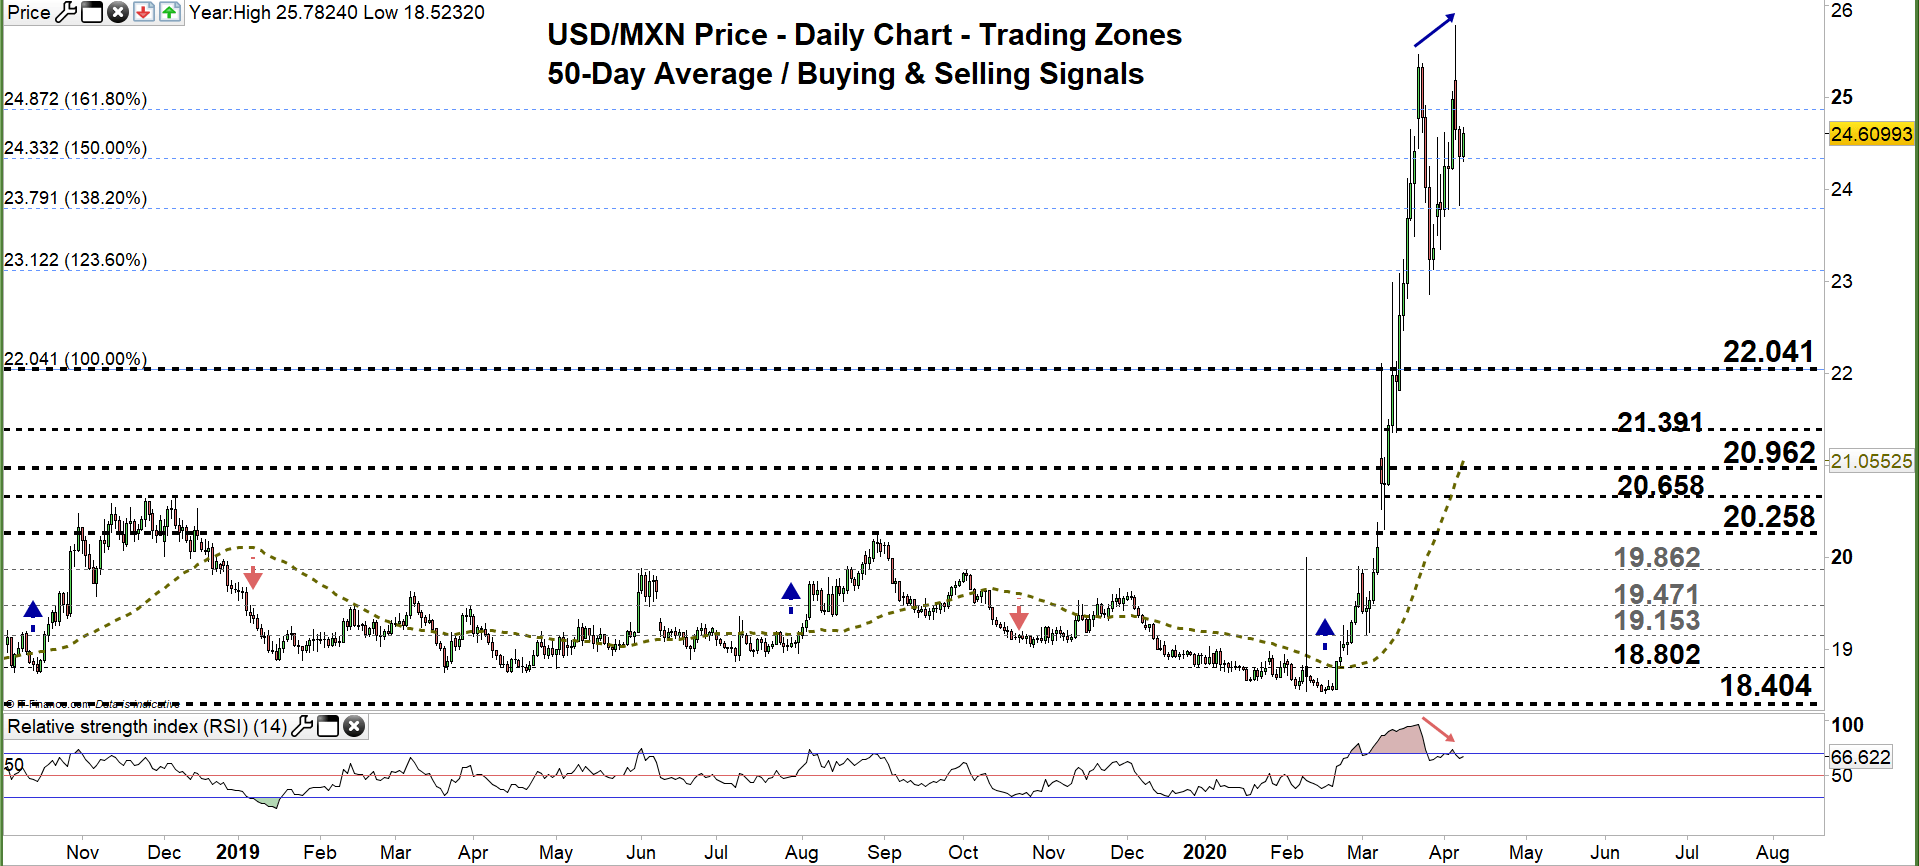
USD/MXN DAILY PRICE CHART (Oct 1, 2018 – April 8, 2020) Zoomed Out

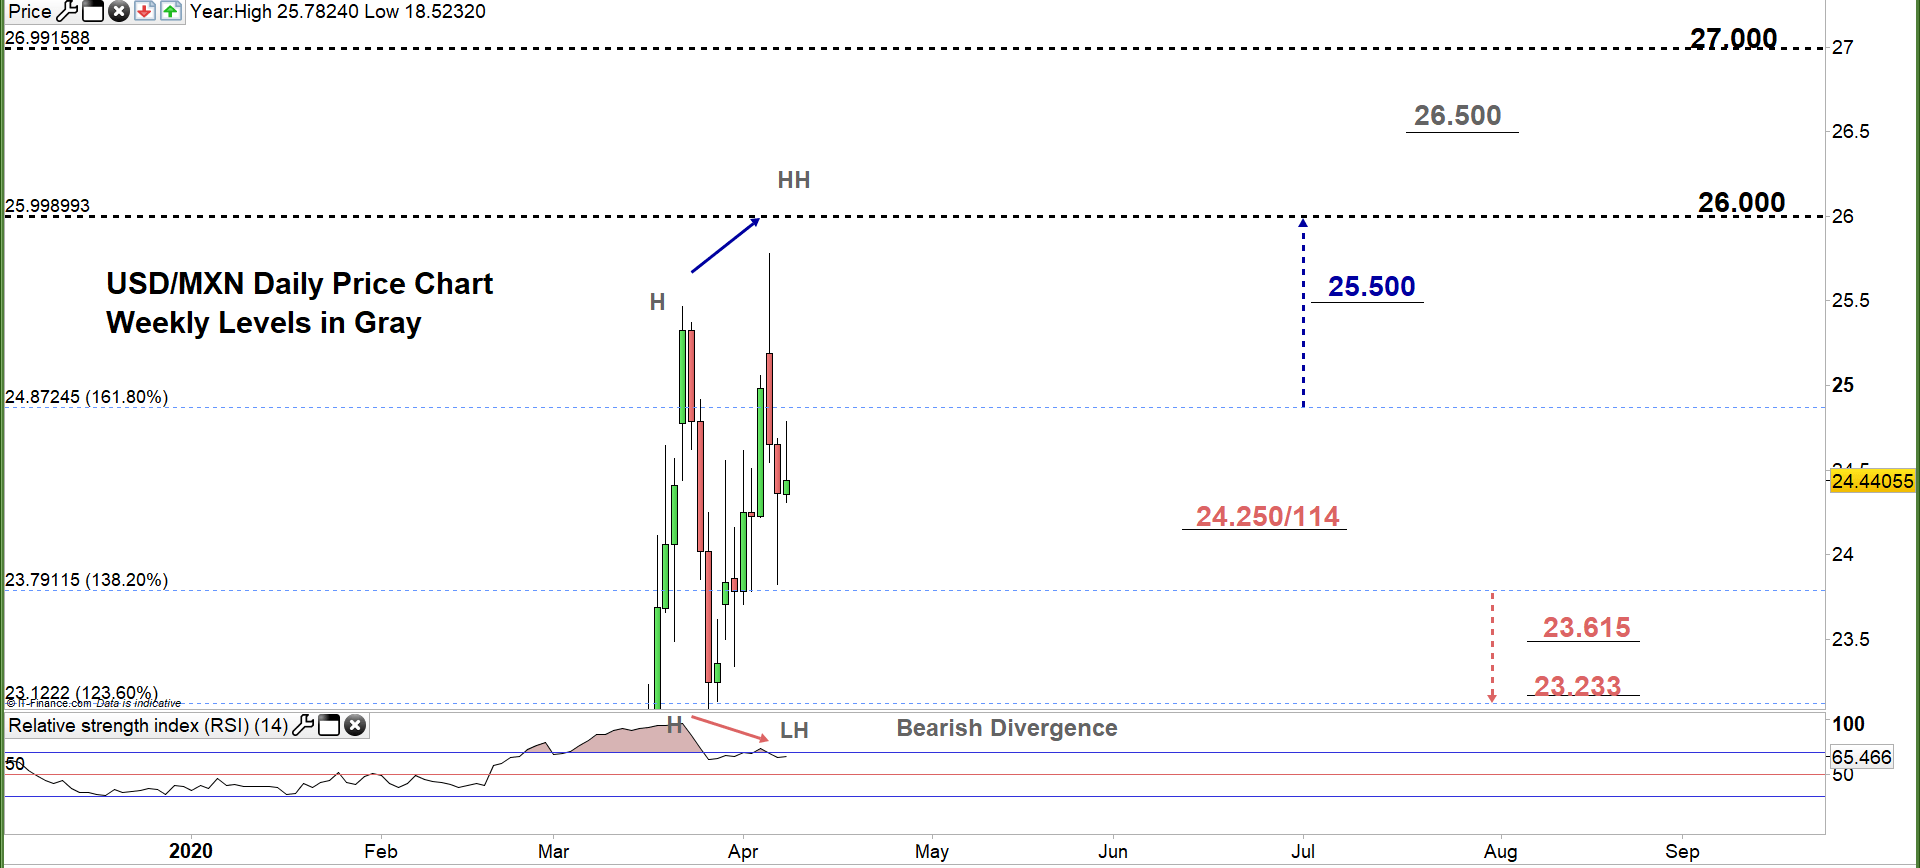
USD/MXN DAILY PRICE CHART (DEC 1 – April 8, 2020) Zoomed In
From the daily chart, we noticed that at the start of this week USD/MXN fell to current trading zone 23.791- 24.872. Yesterday, the price rebounded near the low end of the zone and reversed eyeing a test of the high end.
Additionally, we spot a bearish divergence between the price and RSI, as the first created a high with a higher high meanwhile the latter created a high with a lower high ,signalling a possible uptrend reversal.
A close above the high end of the zone may encourage bulls to push towards 26.000 threshold. Further close above that level could mean more bullishness towards the next threshold at 27.000. That said, the psychological resistance levels underlined on the chart (zoomed in) should be monitored.
On the other hand, any failure in closing above the high end of the zone could reverse the pair’s direction towards the low end of it. Further close below that levels could send USDMXN even lower towards 23.122 . In that scenario, the daily support levels and area marked on the chart should be watched closely.

USD/MXN four hour PRICE CHART (Mar 6 – April 8, 2020)

Looking at the four- hour chart, we notice that on April 6 USD/MXN printed all time high at 25.782. Currently, the pair develops head and shoulders pattern (reversal formation). A violation to the neckline located at 23.825 could send the price towards 21.811.
A break below 23.615 would be considered as another bearish signal. This increases the likelihood for USDMXN to fall towards 123.60 % Fibonacci extension at 23.122. Although, the weekly support level underlined on the chart should be kept in focus. In turn, any break on the other side i.e. above 25.000 handle could cause a rally towards the aforementioned April 6 high. Yet, the daily resistance printed on the chart should be considered.
See the chart to figure out more about key levels to monitor in a further bullish/bearish move.

Written By: Mahmoud Alkudsi
Please feel free to contact me on Twitter: @Malkudsi


