


AUD/USD & NZD/USD TECHNICAL ANALYSIS:
- Australian, New Zealand Dollars tag 11-year lows vs USD
- Swift rebound, RSI divergence hint rebound may be ahead
- 2020 AUD/USD, NZD/USD downtrends are intact for now
The Australian and New Zealand Dollars spiked sharply lower against its US counterpart, tagging the lowest levels in 11 years as dramatic anti-risk liquidation swept financial markets at the start of the trading week. Both currencies have since recoiled higher however, recovering back above swing lows set at the beginning of the month.
AUD/USD nudged the 100% Fibonacci expansion at 0.6309 before retracing higher. It is now trying to secure a close below the 61.8% level at 0.6585. If that occurs, another foray to test the 78.6% Fib at 0.6464 looks likely. Securing a foothold below that and the February 28 low at 0.6434 may bring another challenge near the 0.63 mark. Positive RSI divergence warns the selloff may be fading however.
Initial resistance is in the 0.6671-90 area, marked range floor support-turned-resistance dating back to early August 2019 and the 50% expansion. Breaking above that would double as a breach of the downward-sloping trend line establishing the bounds of the year-to-date descent. Such a move would suggest that immediate pressure has been neutralized and expose the 38.2% Fib at 0.6756 next.
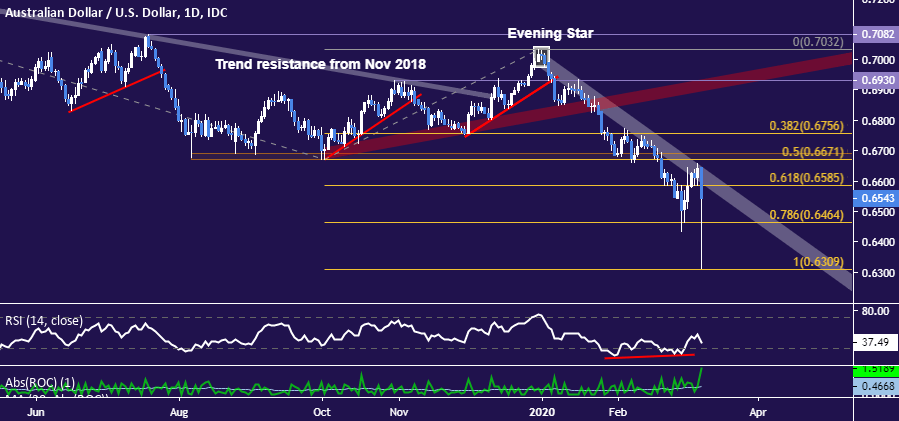
AUD/USD daily chart created with TradingView
NZD/USD attempted to breach five-year support in the 0.6197-0.6245 zone, touching support as low as the 61.8% Fibonacci expansion at 0.6016. The currency pair has since retreated back into the mid-0.62 area. As with its Aussie cousin, positive RSI divergence hints that selling pressure might be ebbing. This may set the stage for a period of sideways consolidation or an outright bounce.
Initial resistance is at 0.6379, a former support level reinforced by a falling trend line guiding the way lower since the beginning of 2020. Recovering above that puts the 0.6425-96 congestion region back into view. Another run at structural resistance establishing the long-term downtrend from July 2017 probably follows a daily close above that threshold.

NZD/USD daily chart created with TradingView

AUD/USD & NZD/USD TRADING RESOURCES
- Just getting started? See our beginners’ guide for FX traders
- Having trouble with your strategy? Here’s the #1 mistake that traders make
- Join a free live webinar and have your trading questions answered
--- Written by Ilya Spivak, Currency Strategist for DailyFX.com
To contact Ilya, use the comments section below or @IlyaSpivak on Twitter


