


Dow Jones Price Outlook
- Dow Jones price chart highlights a possible price fall
- Levels and signals to consider
Dow Jones – Multi-week Low
Last week, the Dow Jones index declined to 28.165 – its lowest level in over three weeks. On Friday, the weekly candlestick closed in the red with 2.3% loss.
The Relative Strength Index (RSI) remained dipped below 50 highlighting a possible start of downtrend move.
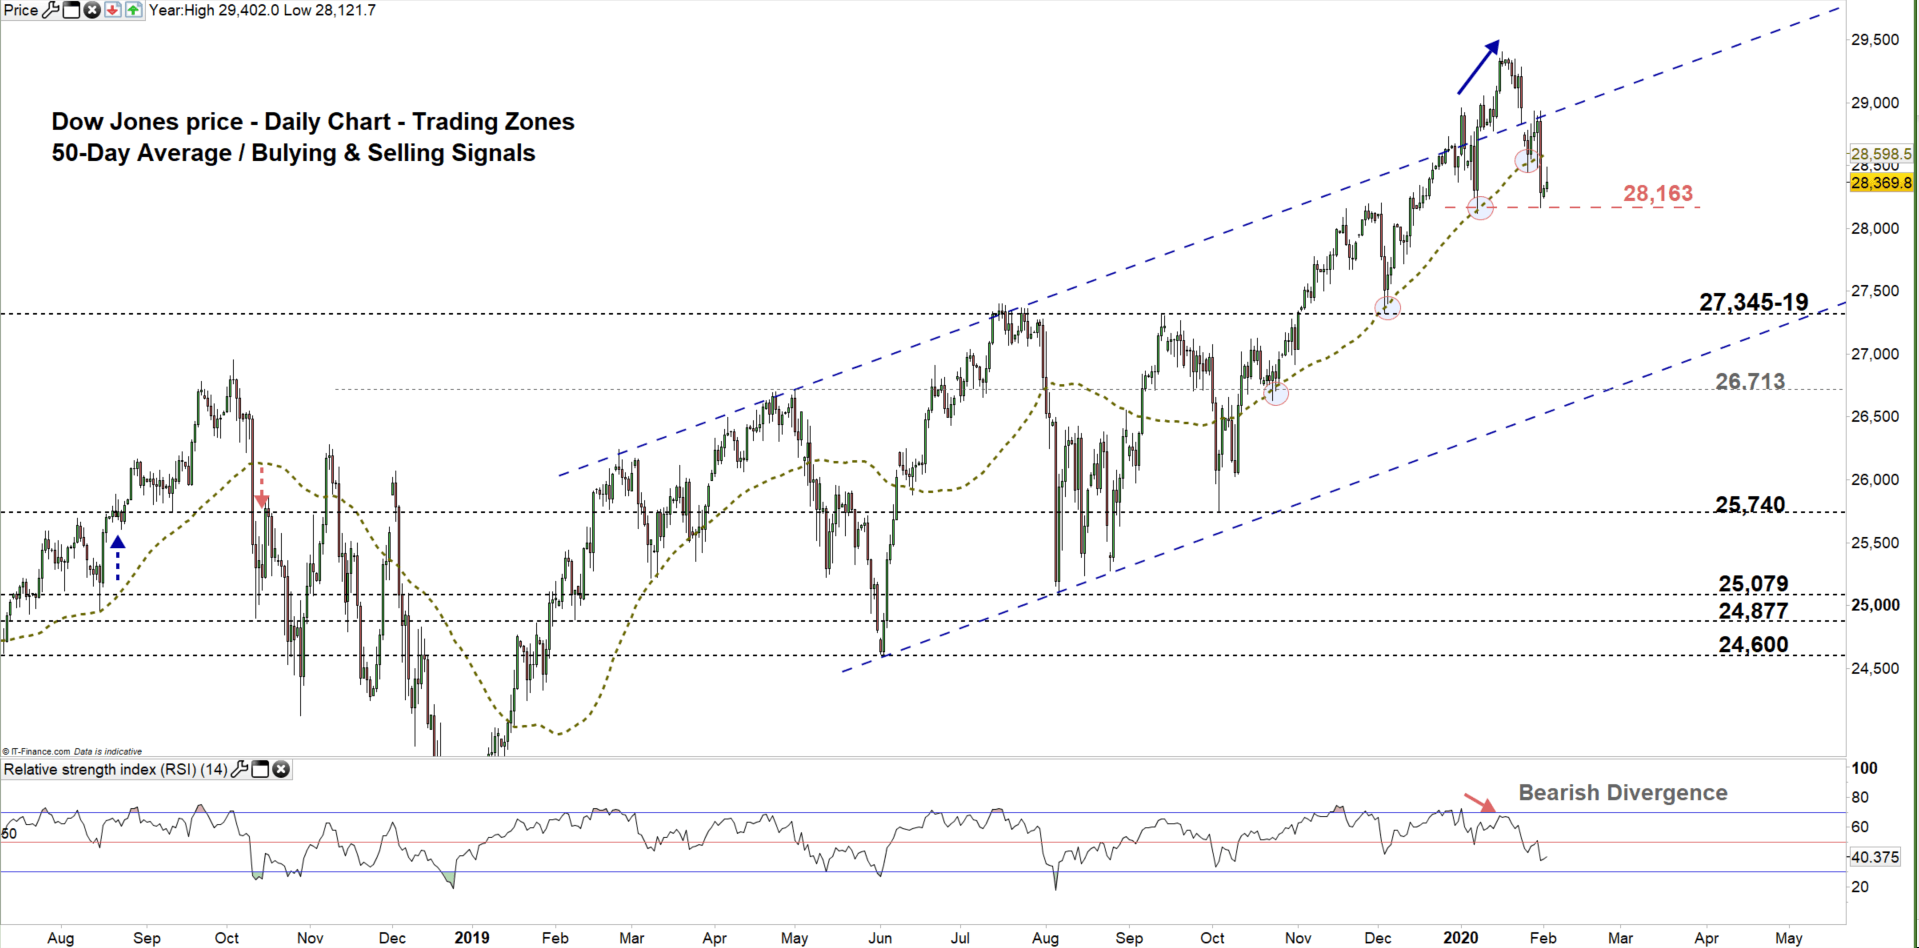
Dow Jones PRICE Daily CHART (July 1, 2018 – Feb 3, 2020) Zoomed OUT

Dow Jones PRICE Daily CHART (AUg 8 – Feb 3, 2020) Zoomed IN

Looking at the daily chart, we notice that on Jan 17 the Dow peaked at 29,402 creating a high with higher high meanwhile the RSI created a high with lower high signaling a bearish divergence and a possible price reversal. See the chart (zoomed out).
Last week, the price could not overtake the upper line of the uptrend channel reflecting bull’s hesitation. On Friday, the Dow closed below the 50-Day average for the first time since Oct 10 generating another bearish signal.
Currently, the Dow develops head and shoulders pattern. Thus, a break below the neckline located at 28,163 could lead the price towards 26,913.
A close below 27,319 may send the index towards 26.713. Further close below this level could encourage the Dow bears to press towards 25,740. In that scenario, the weekly support levels underlined on the chart (zoomed in).
On the flip side, a close above the uptrend channel may end bull’s hesitation and possibly encourage them to push the price to a new all time high.

Dow Jones Four Hour PRICE CHART (DEC 20, 2018 – Feb 3, 2020)

Looking at the daily chart, we notice on Friday the Dow rebounded from three weeks low then closed with a bullish Doji pattern.
A break above 28,579 may send the price towards 28,935. Yet, the daily resistance level marked on the chart should be kept in focus. On the other hand, a break below 28,069 could mean more bearishness towards 27.715. Nevertheless, the weekly support level underscored on the chart should be watched closely.
See the chart to figure out more about the key technical levels in a further bullish/bearish scenario.
Written By: Mahmoud Alkudsi
Please feel free to contact me on Twitter: @Malkudsi


