


New Zealand Dollar, NZD/USD, NZD/JPY – Talking Points
- New Zealand Dollar broader technical picture may be focusing lower
- NZD/USD recently cleared near-term support, more progress needed
- NZD/JPY facing key support, rising trend line maintaining upside bias
New Zealand Dollar, Majors-Based NZD Index – Technical Analysis
The New Zealand Dollar could be at risk to broad weakness against some of its major counterparts such as the US Dollar and Japanese Yen. Taking a look at my majors-based New Zealand Dollar index, the currency has broken under a medium-term rising trend line from October – red line on the chart below. The index’s value is derived by averaging NZD’s performance against its most-liquid peers: USD, EUR, GBP and JPY.
This helps paint a broader picture for the Kiwi Dollar. The currency topped in late December after leaving behind resistance, taking it out would entail the resumption of the uptrend. A confirmatory daily close to the downside could on the other hand pave the way to revisit levels NZD has on average not seen since early December. If the latter is the case, it would arguably shift the medium-term technical bias to the downside.
NZD Daily Chart

Chart Created Using TradingView
NZD/USD Technical Analysis
Focusing on NZD/USD, prices have extended losses since taking out near-term rising support from November. Yet the pair remains above the former descending trend line from March 2019. A descent through it could shift the focus to medium-term losses. That would pave the way to test a rising support channel from October. Near-term falling resistance is the red line from the December peak on the chart below.

NZD/USD Daily Chart

Chart Created Using TradingView
NZD/JPY Technical Analysis
After some negative RSI divergence, NZD/JPY turned lower as upside momentum faded around key resistance. The latter is a psychological barrier between 73.24 to 73.53 on the chart below. Key support is a horizontal range below at 71.73 and 71.99. Taking the latter out, in addition to rising support from October, places the focus on medium-term losses in NZD/JPY.

NZD/JPY Daily Chart
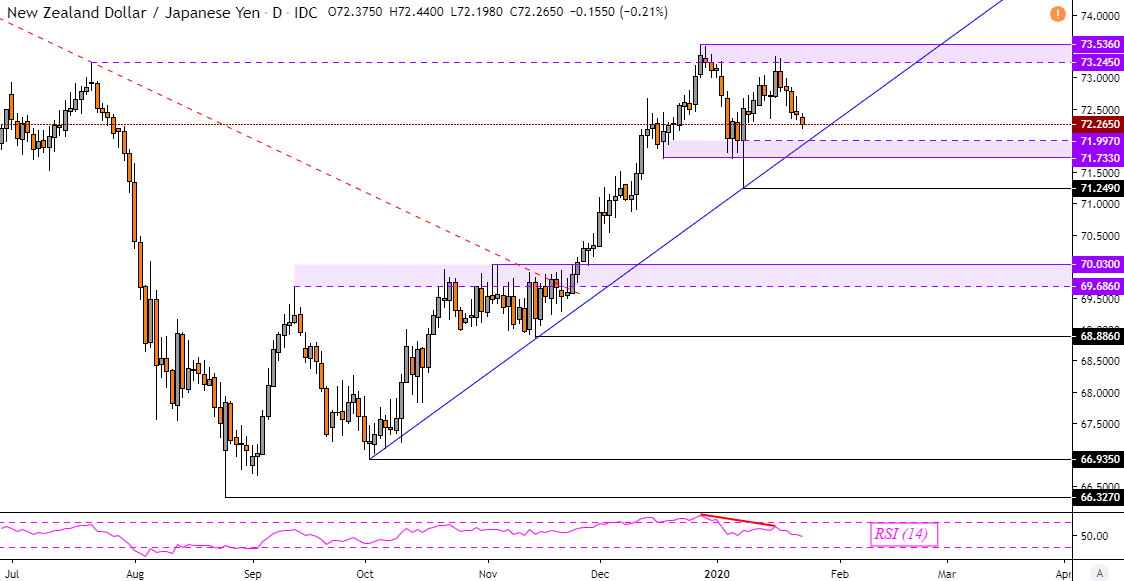
Chart Created Using TradingView
--- Written by Daniel Dubrovsky, Currency Analyst for DailyFX.com
To contact Daniel, use the comments section below or @ddubrovskyFX on Twitter


