


NZD/JPY TECHNICAL ANALYSIS – Talking Points:
- NZD/JPY testing five-year downtrend resistance after risk-on bounce
- Head and Shoulders pattern, trend line break hint topping in the works
- Confirmation on a break of neckline support expected to expose 70.00

The New Zealand Dollar has been trending lower against the Japanese Yen since topping in December 2014. In May 2018, sellers pushed prices below rising trend line support based from the post-crisis low in early 2009, suggesting that a structural bearish bias had been established.
Prices are now retesting downward-sloping resistance defining the long-term decline having bounced from a seven-year low amid broadly improving risk appetite across financial markets in the fourth quarter of 2019. This barrier is reinforced by former support in the 72.36-73.25 area dating back to August 2015.

NZD/JPY monthly chart created with TradingView
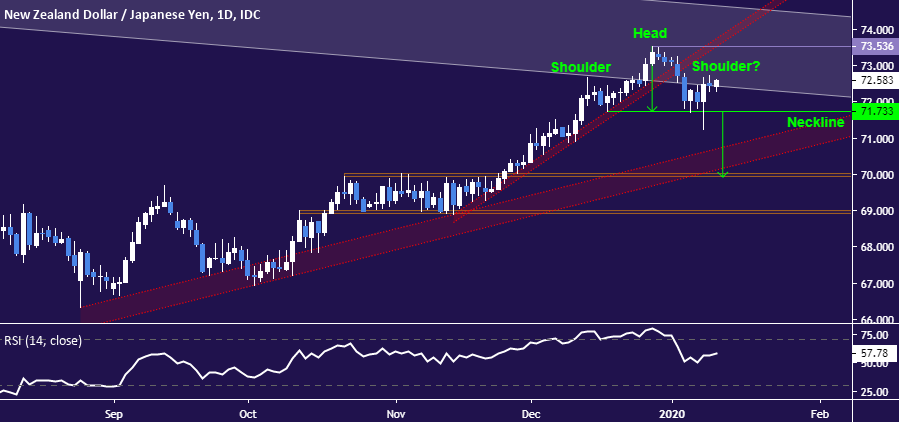
Zooming in to the daily chart suggests a reversal from resistance may be getting underway. Prices broke below rising trend line support set form mid-November and now appear to be carving out a bearish Head and Shoulders (H&S) topping pattern.
Confirmation of reversal on a daily close below the H&S neckline at 71.73 would imply a measured downside objective near the 70.00 figure. Perhaps most interestingly, such a move is likely to clear support established from late August, painting recent gains as corrective and triggering long-term downtrend resumption.
NZD/JPY monthly chart created with TradingView
Invalidating the H&S setup and the broader case for topping probably requires a daily close 73.54, the December 27 high. Neutralizing the long-term bearish bias demands a breach of the five-year falling trend line, now at 74.74.

NZD/JPY TRADING RESOURCES
- Just getting started? See our beginners’ guide for FX traders
- Having trouble with your strategy? Here’s the #1 mistake that traders make
- Join a free webinar and have your questions answered
--- Written by Ilya Spivak, Currency Strategist for DailyFX.com
To contact Ilya, use the comments section below or @IlyaSpivak on Twitter


