


USD/TRY Price Outlook
Check our latest Q3 forecasts for free and learn what is likely to move the markets at this time of the year.
USD/TRY – Buyers Still in Charge
On Sep 4, USD/TRY reversed direction after rebounding from its lowest level in nearly two weeks creating a higher low at 5.6485. The price rallied at the start of this week highlighting that the uptrend momentum is still on.
Alongside this the Relative Strength Index (RSI) U-turned from 43 and crossed 50 again indicating that buyers were not done yet.
Having trouble with your trading strategy? Here’s the #1 Mistake That Traders Make
USD/TRY DAILY PRICE CHART (May 28, 2018 – SEp 11, 2019) Zoomed Out

USD/TRY DAILY PRICE CHART (May 1– Sep 11, 2019) Zoomed In
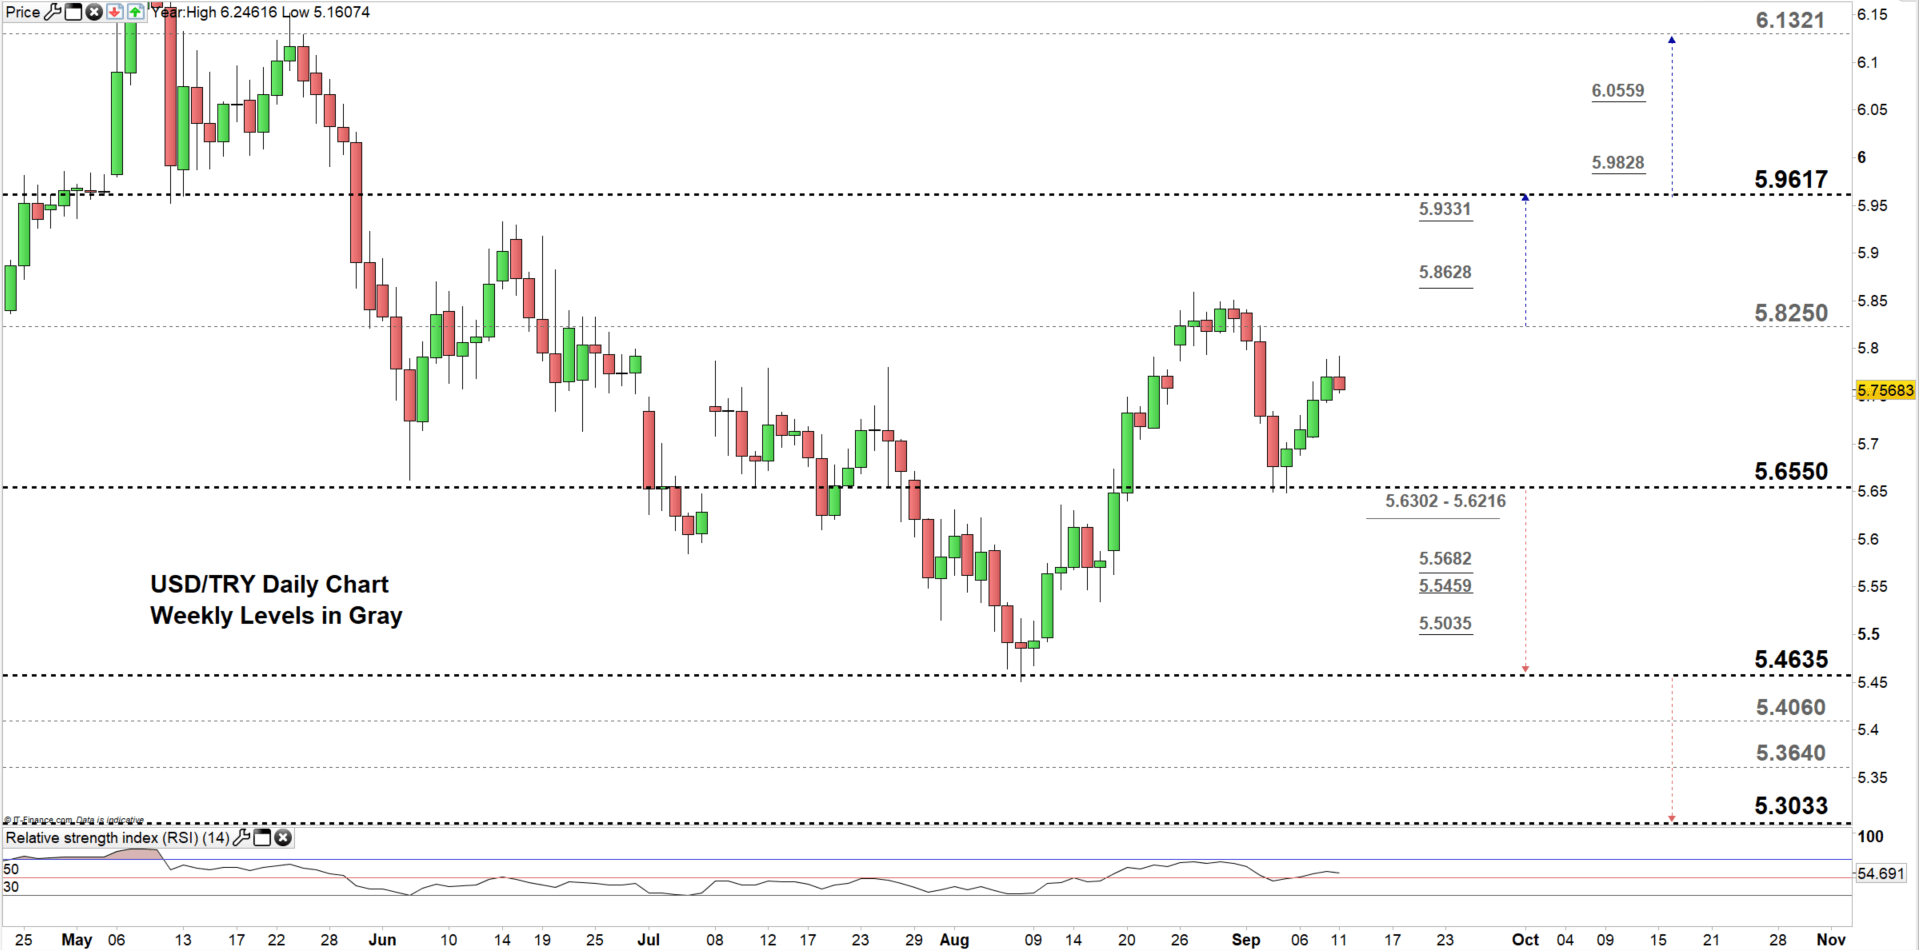
Looking at the daily chart, we notice on Friday USD/TRY rallied eying a test of the high end of current trading zone 5.6550 – 5.8250.
Thus, a close above the high end of the zone could push USDTRY towards 5.9617. Further close above this may see the price trading even higher towards 6.1321. That said, buyers need to pay a close attention to the weekly resistance levels underlined on the chart (zoomed in).
On the other hand, any failure to close above the high end of the zone, could change the pair’s course sending it back towards the low end. Further close below the low end may cause more bearishness towards 5.4635. Although, the weekly support area and levels marked on the chart should be kept in focus.
Just getting started? See our Beginners’ Guide for FX traders
USD/TRY Four-HOUR PRICE CHART (Aug 8, – Sep 11, 2019)
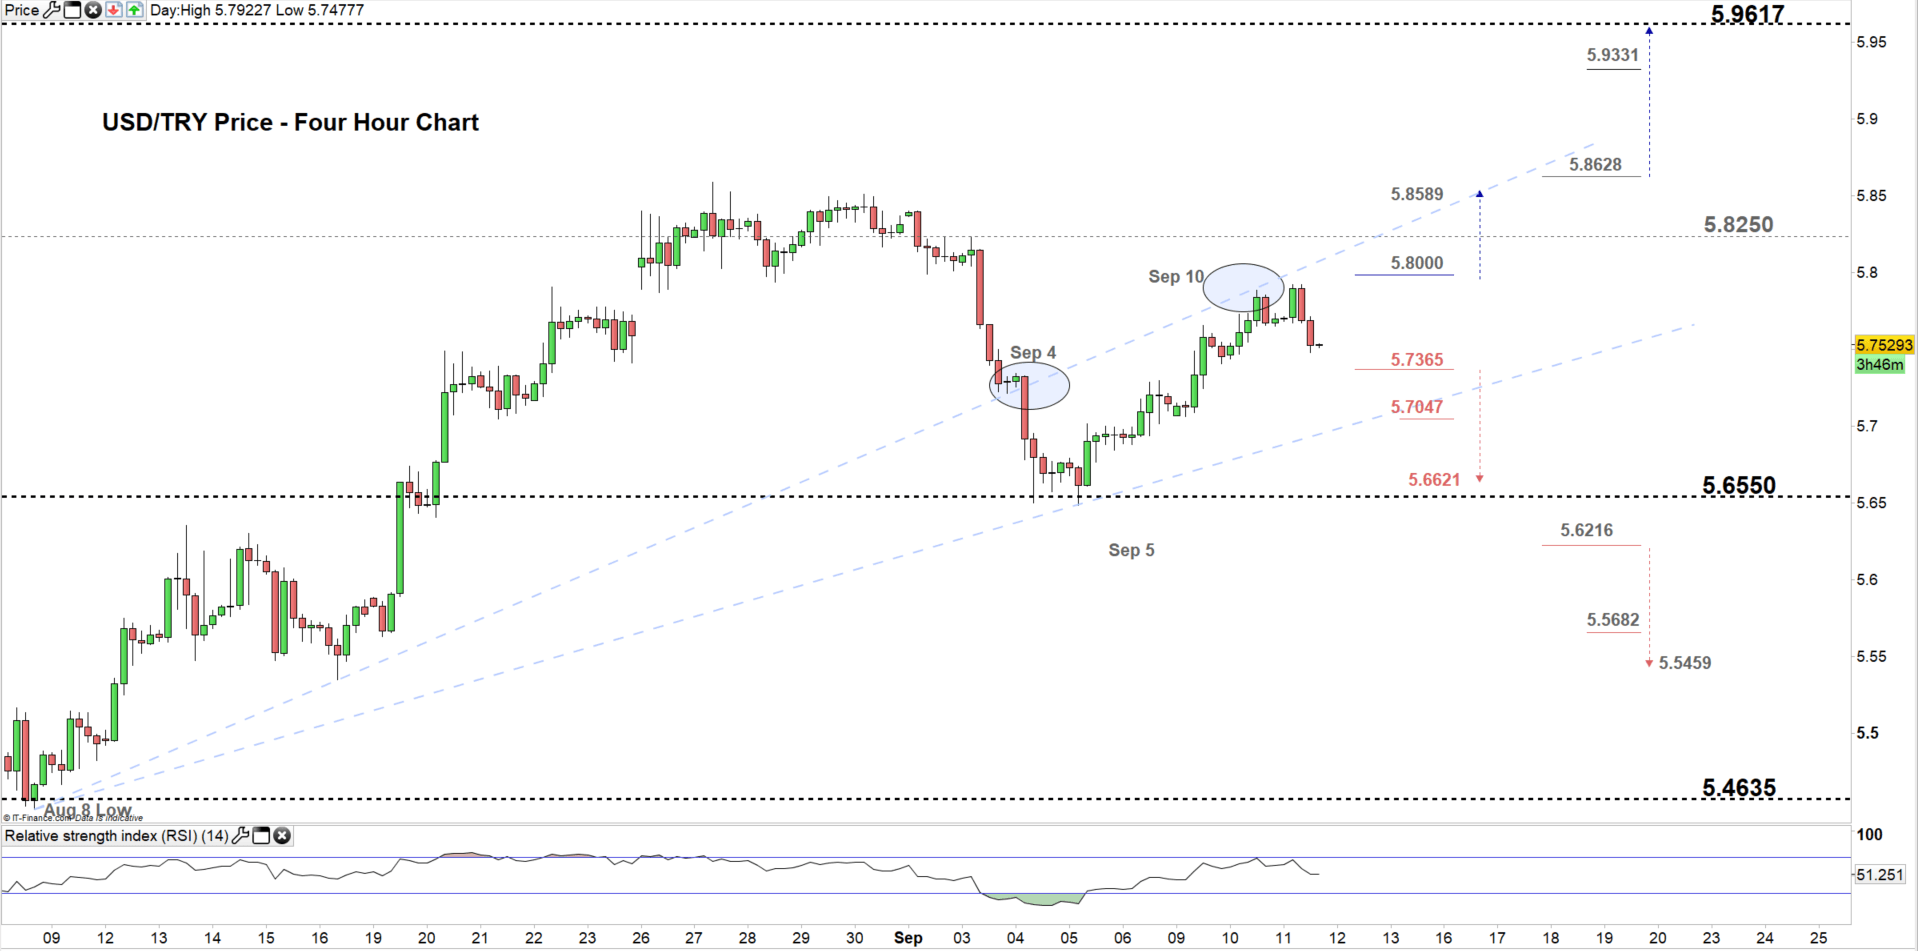
From the four-hour chart, we notice yesterday USD/TRY rebounded from the uptrend line originated from the August 4 low at 5.4508. Hence, the pair may need to overtake this trendline to continue bullish price action.
Thus, a break above 5.8000 handle could push the price towards 5.8589. Although, the high end of the aforementioned trading zone needs to be considered. See the chart to know more about higher resistance levels USDTRY would encounter in a further bullish scenario.
In turn, a break below 5.7365 may press USDTRY towards 5.6621. Nonetheless, the daily support level underlined on the chart should be monitored. See the chart to know more about lower support levels the price would encounter in a further bearish move.
Written By: Mahmoud Alkudsi
Please feel free to contact me on Twitter: @Malkudsi


