


Brexit Latest Talking Points:
- Now that UK parliament has been prorogued, and steps to prevent a no-deal, hard Brexit have been taken, the British Pound has been given some breathing room to recover.
- The efforts by UK parliament mean that there can’t be a general election until November at the earliest – meaning UK Prime Boris Johnson will have to back off of his attitude to leave the EU on October 31, no matter what.
- Retail trader positioning suggests that Sterling rates may rally over the coming sessions.
Looking for longer-term forecasts on the British Pound? Check out the DailyFX Trading Guides.
Now that UK parliament has been prorogued, and steps to prevent a no-deal, hard Brexit have been taken, the British Pound has been given some breathing room to recover. Even though UK parliament has been sidelined until October 14, when MPs return for the Queen’s Speech, there are few options left for UK Prime Minister Boris Johnson.
The efforts by UK parliament mean that there can’t be a general election until November at the earliest – the steps to prevent a no-deal, hard Brexit on October 31 can’t be altered unless a three-month negotiation window extension is agreed upon. This means UK PM Johnson will have to back off his ‘whatever it takes’ attitude to leave the EU on October 31.
The October 17 EU leadership summit may be the last gasp effort to push back the Brexit data before the no-deal legislation deadline arrives on October 19. In the meantime, there appears to be ample room for the British Pound to stage a short-term recover, assuming that UK PM Johnson doesn’t take any steps to try and circumvent the UK parliament once more.
GBPUSD TECHNICAL ANALYSIS: WEEKLY RATE CHART (JUNE 2016 TO September 2019) (CHART 1)
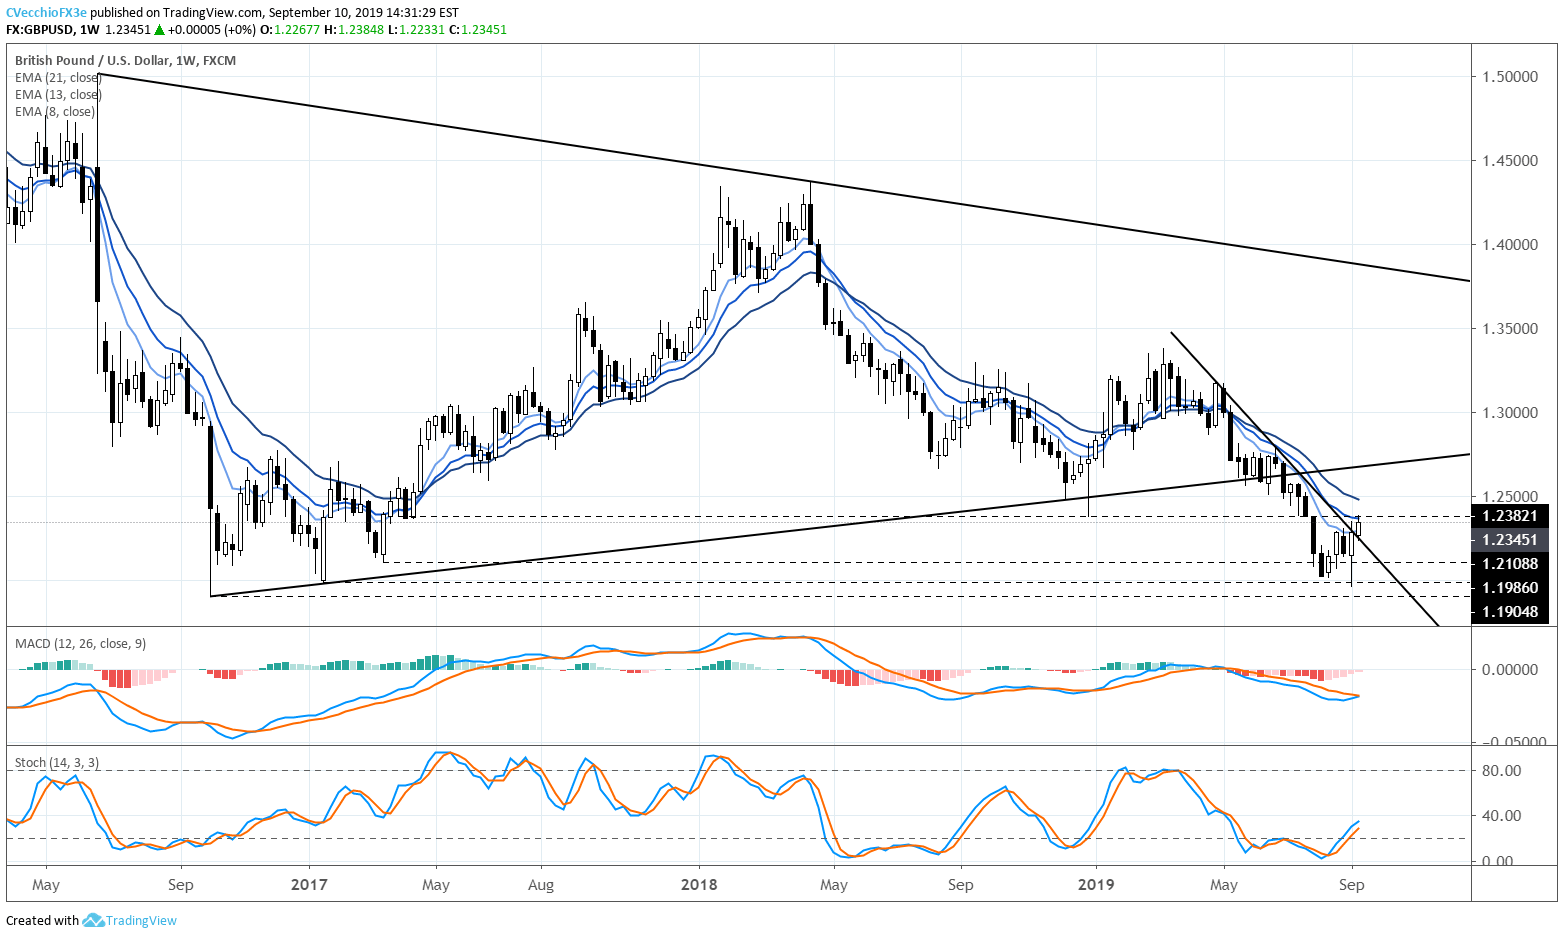
In our last GBPUSD technical forecast update, it was noted that “it still holds that only a break above the weekly 8-EMA, as well as the descending trendline from the May and June 2019 highs, would give traders reason to expect GBPUSD prices to trend higher.” The bullish outside engulfing bar last week suggests greater upside potential; follow through to the topside this week is now seeing GBPUSD rates break above the descending trendline from the May and June 2019 highs.
GBPUSD Technical Analysis: Daily Rate Chart (September 2018 to September 2019) (Chart 2)

In our last GBPUSD technical forecast update, it was also noted that “the daily and the weekly candles are forming hammers, suggesting bullish reversal potential.” The break above the descending trendline from the May and June 2019 highs last week was buffeted by a bullish outside engulfing bar on Monday, September 9.
With GBPUSD rates above the daily 8-, 13-, and 21-EMA envelope in bullish sequential order, Slow Stochastics in overbought territory, and daily MACD rising through its signal line into bullish territory, it appears that the path of least resistance is to the topside. A break above 1.2380/85 – a key band of support/resistance dating back to 2017, including the January 2019 Japanese Yen flash crash low and the July 2019 swing low – would suggest that the trend has indeed turned in a more reliable fashion.
IG Client Sentiment Index: GBPUSD Rate Forecast (September 10, 2019) (Chart 3)

GBPUSD: Retail trader data shows 64.1% of traders are net-long with the ratio of traders long to short at 1.78 to 1. In fact, traders have remained net-long since May 6 when GBPUSD traded near 1.3040; price has moved 5.4% lower since then. The number of traders net-long is 3.6% lower than yesterday and 20.2% lower from last week, while the number of traders net-short is 2.7% higher than yesterday and 31.5% higher from last week.
We typically take a contrarian view to crowd sentiment, and the fact traders are net-long suggests GBPUSD prices may continue to fall. Yet traders are less net-long than yesterday and compared with last week. Recent changes in sentiment warn that the current GBPUSD price trend may soon reverse higher despite the fact traders remain net-long.
GBPJPY Technical Analysis: Weekly Rate Chart (October 2016 to September 2019) (Chart 4)
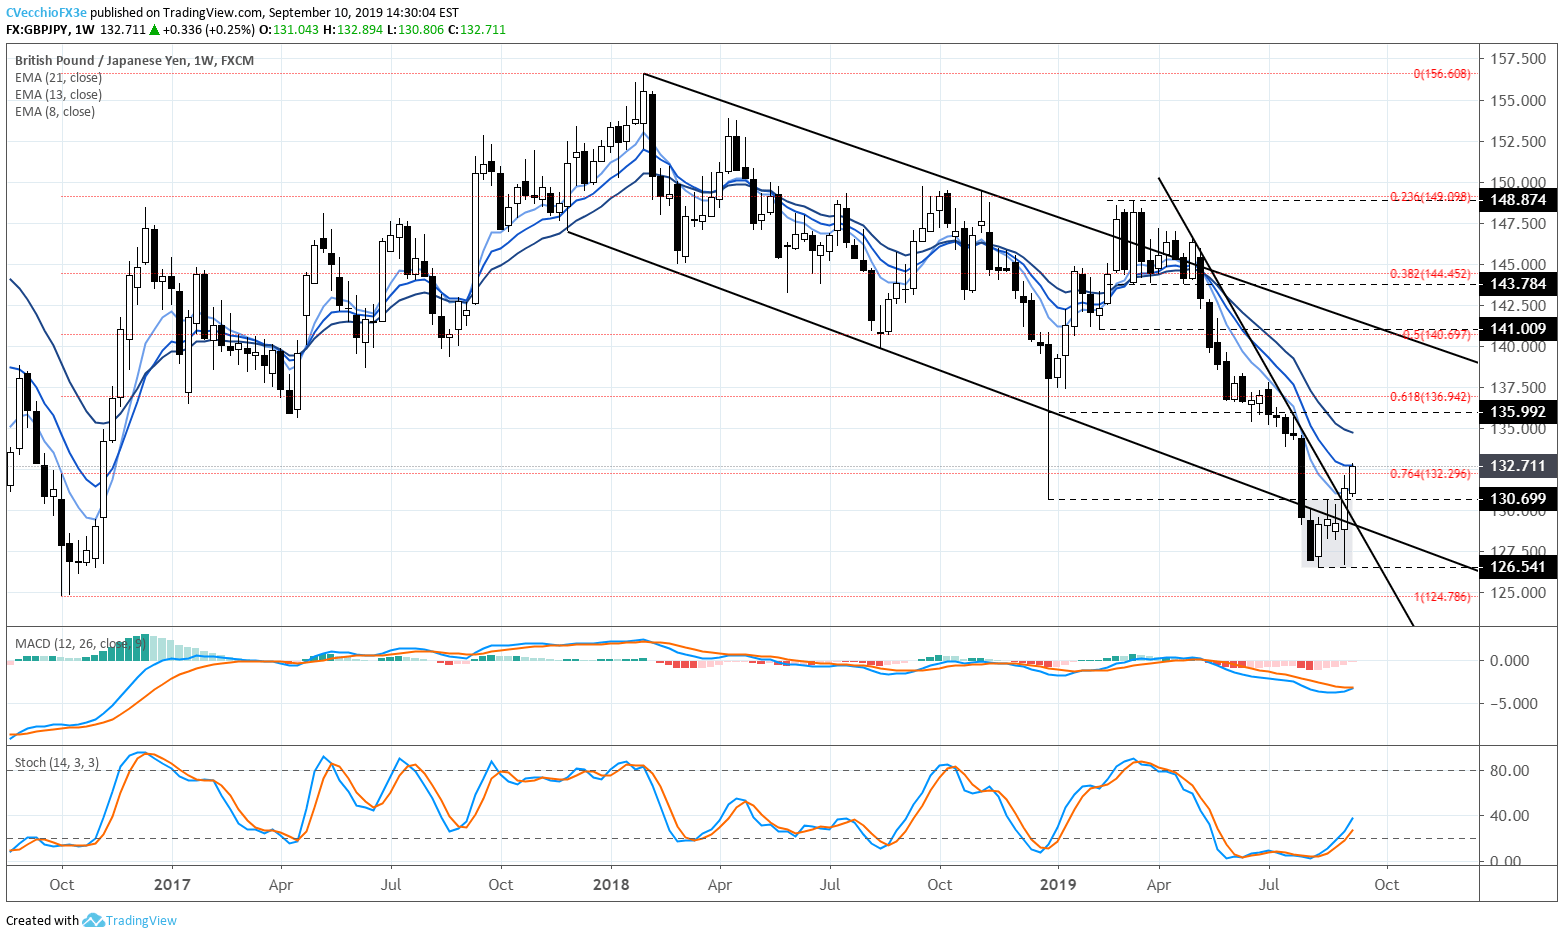
In our last GBPJPY technical forecast update, it was noted that “a new short-term range has come into focus when examining GBPJPY price action since the end of July.” By the end of last week, the range had broken to the topside, with GBPJPY rates clocking a bullish outside engulfing bar/key reversal on the weekly timeframe. Now, GBPJPY rates have risen back to the weekly 13-EMA, the one-quarter moving average.
GBPJPY Technical Analysis: Daily Rate Chart (August 2018 to September 2019) (Chart 5)
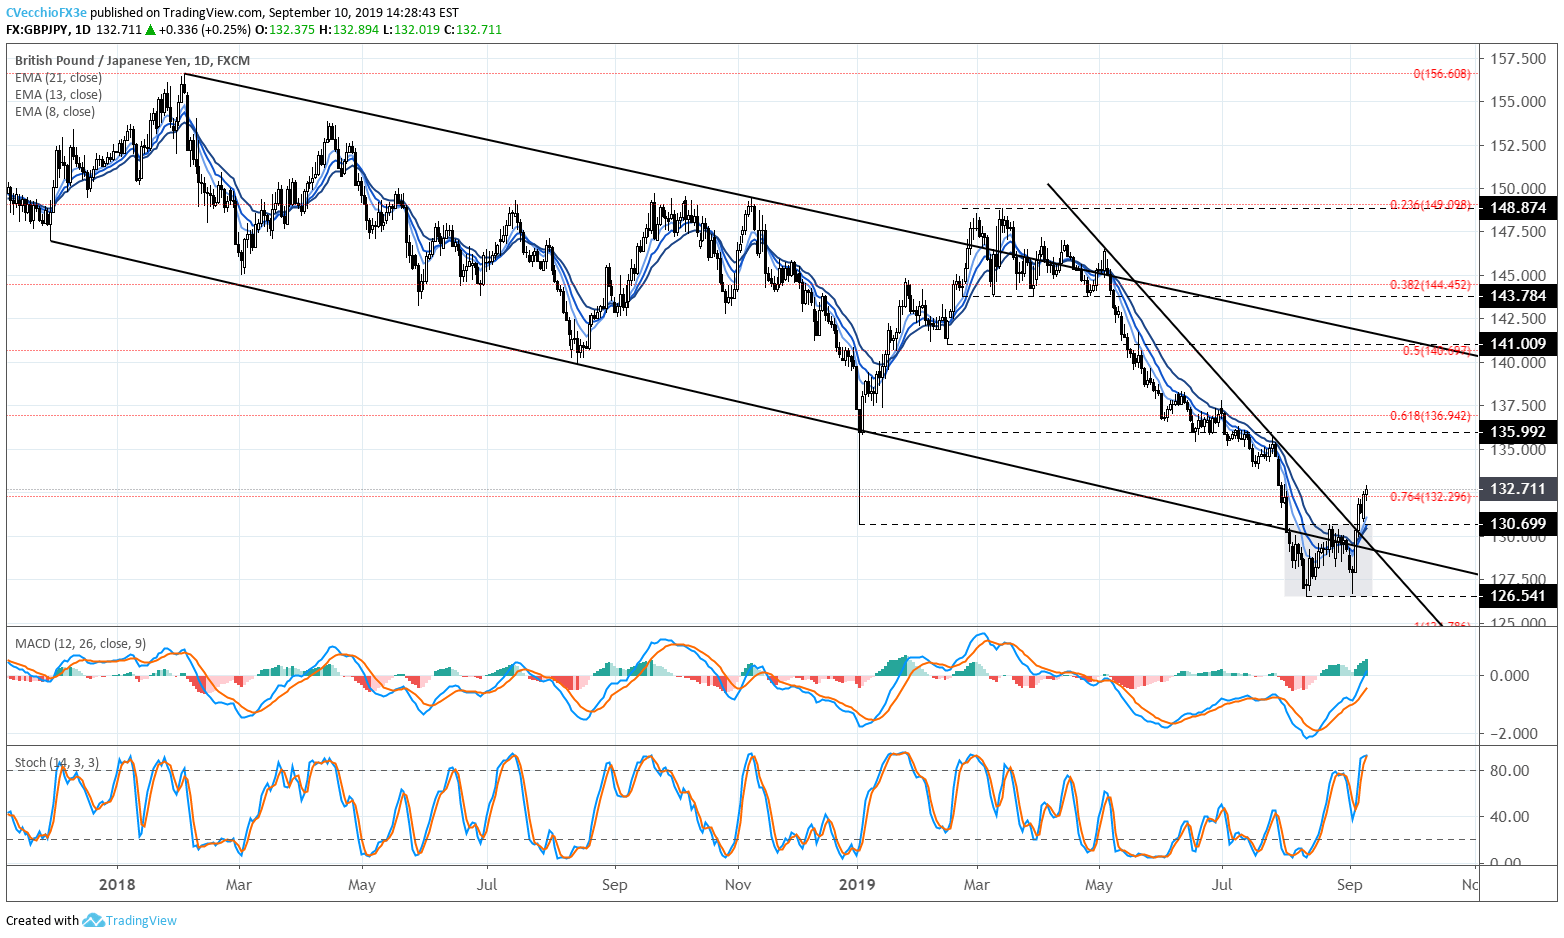
In our last GBPJPY technical forecast update, it was noted that “a break above the former 2019 low (set around the Yen flash crash in January 2019) would suggest a more bottoming effort is coming into shape. A move above 130.70 would suggest the low has been set…the new short-term range resistance [is] at 130.70 and support [is] at 126.54: until these levels break, the outlook for GBPJPY is neutral.”
GBPJPY rates broke above 130.70 on Thursday, September 5, clearing out the descending trendline from the May and July 2019 swing highs in the process. Now that GBPJPY rates are comfortably above the daily 8-, 13-, and 21-EMA envelope, and that both daily MACD and Slow Stochastics have risen into bullish territory (the latter is overbought), it would stand to reason that the criteria for a short-term bottom have been met.
Key levels to the topside are 135.92 (January 2019 Japanese Yen flash crash close) and 136.94 (61.8% retracement of the 2018 high/low range). The call for a short-term bottoming effort would be invalidated on a return below 130.70.
IG Client Sentiment Index: GBPJPY Rate Forecast (September 10, 2019) (Chart 6)
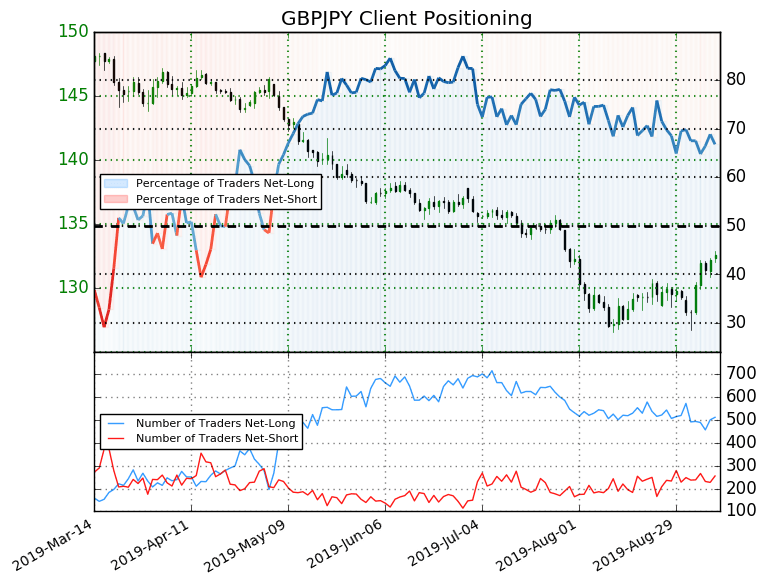
GBPJPY: Retail trader data shows 66.8% of traders are net-long with the ratio of traders long to short at 2.01 to 1. In fact, traders have remained net-long since May 6 when GBPJPY traded near 145.99; price has moved 9.2% lower since then. The number of traders net-long is 1.3% lower than yesterday and 0.2% lower from last week, while the number of traders net-short is 12.3% higher than yesterday and 8.1% higher from last week.
We typically take a contrarian view to crowd sentiment, and the fact traders are net-long suggests GBPJPY prices may continue to fall. Yet traders are less net-long than yesterday and compared with last week. Recent changes in sentiment warn that the current GBPJPY price trend may soon reverse higher despite the fact traders remain net-long.
EURGBP Technical Analysis: Monthly Rate Chart (1994 to 2019) (Chart 7)
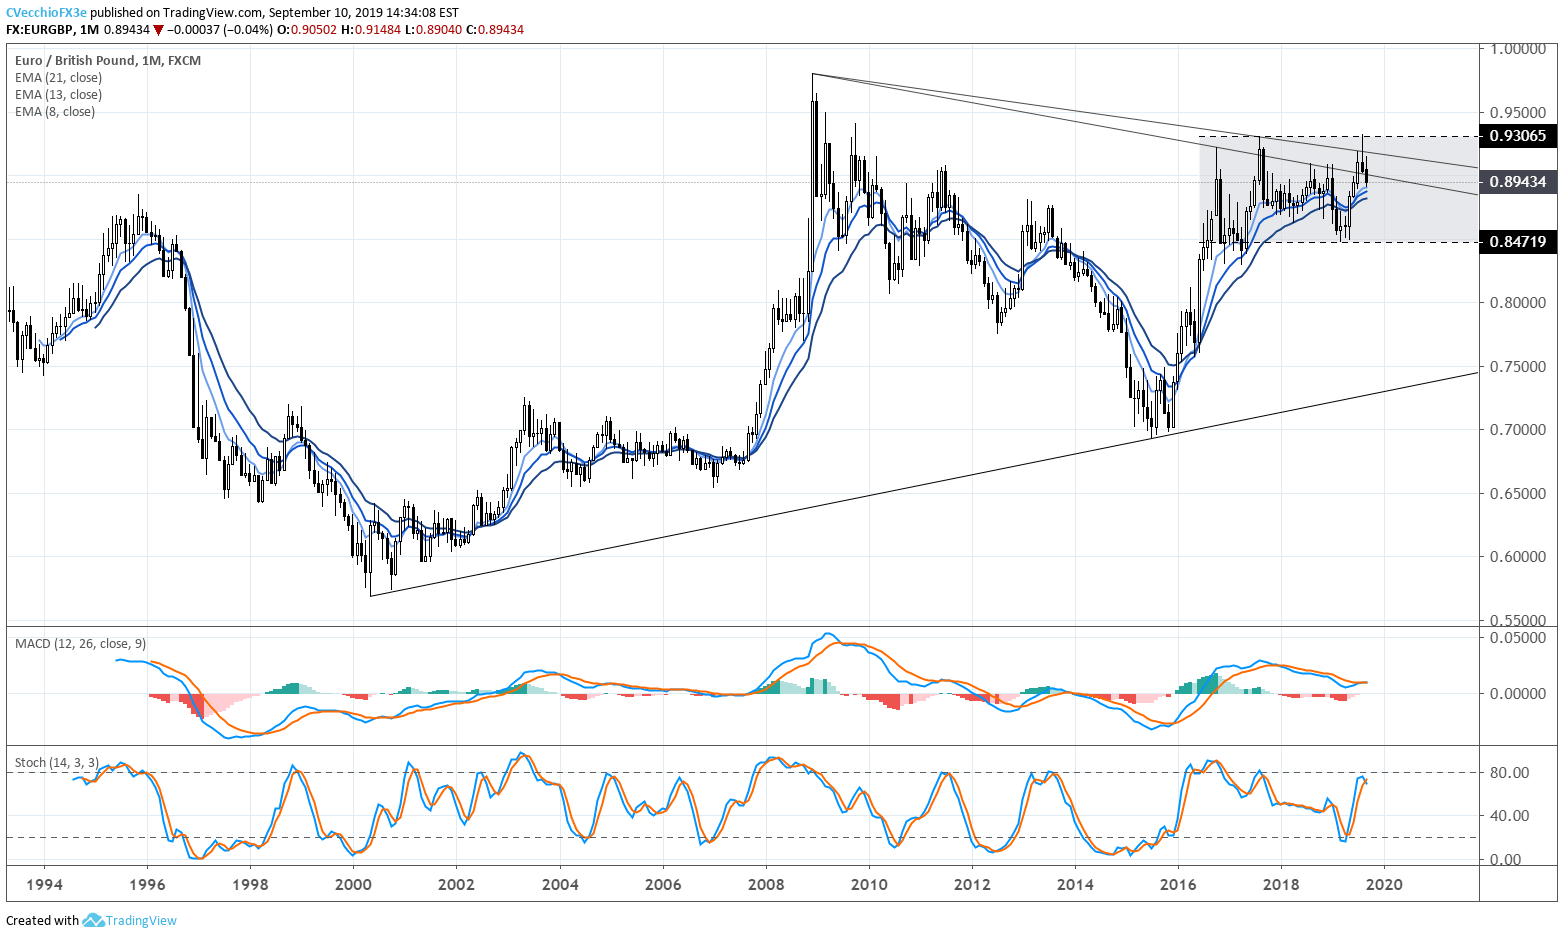
In our last EURGBP technical forecast update, it was noted that “the EURGBP monthly timeframe remains instructive given the August inverted hammer – often a sign of a bearish reversal…Failure to find follow through to the topside means that the more significant bullish breakout is on pause: the symmetrical triangle that has defined nearly the entirety of EURGBP’s trading history, going back to the lows in 2000 and the highs in 2008.” Thus far in September, EURGBP rates have continued to find follow through lower after the inverted hammer in August.
EURGBP Technical Analysis: Daily Rate Chart (September 2018 to September 2019) (Chart 8)
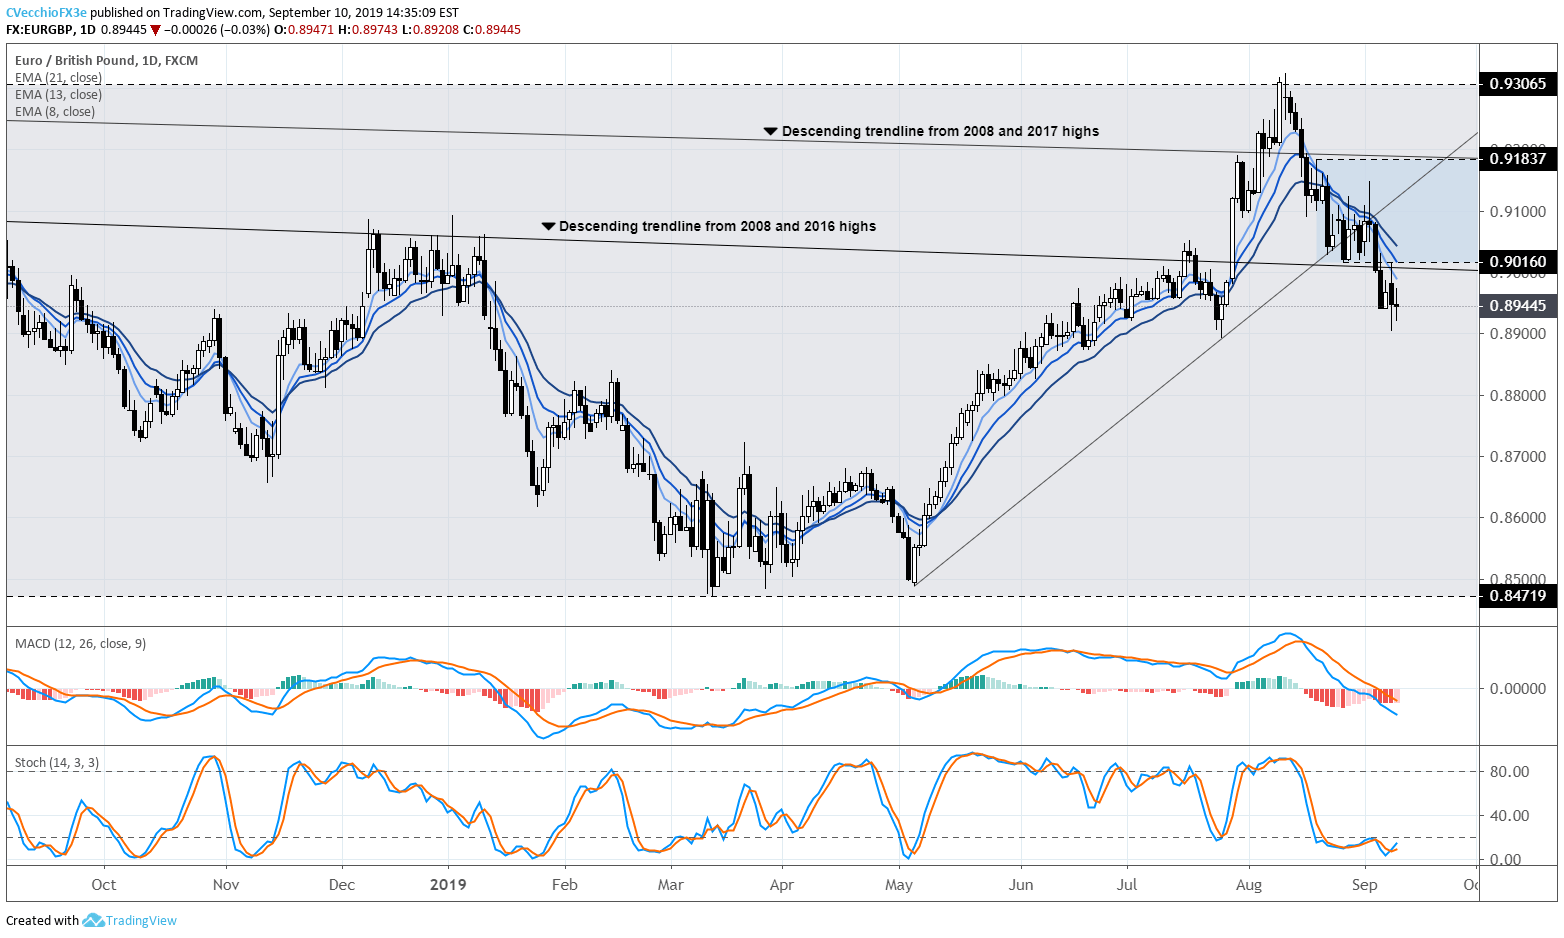
In our last EURGBP technical forecast update, it was noted that “traders should keep an eye on the range defined by the August 20 bearish outside engulfing bar and the August low between 0.9016 and 0.9184..the scope for a deeper pullback would exist below 0.9016, give the break of the uptrend from the May and July 2019 lows as well as the drop back under the descending trendline from the 2008 and 2016 highs.”
As of Wednesday, September 4, EURGBP rates had fallen below the range support at 0.9016. There has been follow through to the downside, with the daily 8-, 13-, and 21-EMA in sequential bearish order. Daily MACD is trending lower in bearish territory, while Slow Stochastics have held steady in oversold territory. A drop below the July 25 swing low at 0.8892 would suggest a deeper pullback is likely to occur.
IG Client Sentiment Index: EURGBP Rate Forecast (September 10, 2019) (Chart 9)
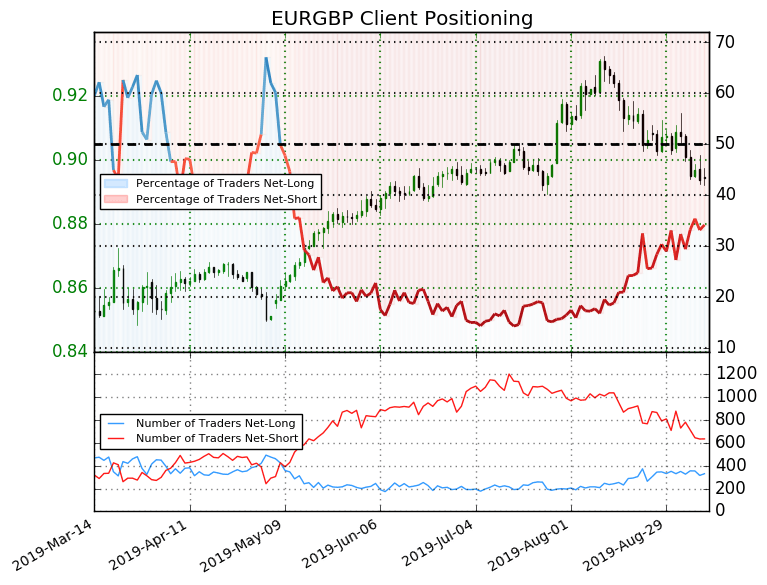
EURGBP: Retail trader data shows 34.2% of traders are net-long with the ratio of traders short to long at 1.92 to 1. In fact, traders have remained net-short since May 9 when EURGBP traded near 0.8656; price has moved 3.3% higher since then. The number of traders net-long is 8.6% lower than yesterday and 4.3% lower from last week, while the number of traders net-short is 1.6% higher than yesterday and 14.1% lower from last week.
We typically take a contrarian view to crowd sentiment, and the fact traders are net-short suggests EURGBP prices may continue to rise. Traders are further net-short than yesterday and last week, and the combination of current sentiment and recent changes gives us a stronger EURGBP-bullish contrarian trading bias.
What Happens to the British Pound: No Deal, Hard Brexit
Under a no-deal, hard Brexit outcome, traders should expect further losses by the British Pound, with EURGBP likely to trade closer to parity (1.0000), GBPJPY could trade towards 120.00, while GBPUSD could fall towards 1.1000 during the first 12-months of a no-deal, hard Brexit (keeping in mind that the European Central Bank and Federal Reserve would likely cut interest rates to prevent Brexit shocks from impacting either the Eurozone or US economies too significantly, thereby capping potential gains by the Euro and the US Dollar versus the British Pound).
What Happens to the British Pound: No Deal, Hard Brexit + Scottish Exit
But this would not be the worst case scenario for the British Pound; in the event that Scotland holds a second independence referendum, it’s likely markets will be facing down the threat of disintegration of Great Britain as we know it. Under a no-deal, hard Brexit coupled with a Scottish vote to leave the UK, traders should expect EURGBP to climb towards 1.0500, GBPJPY to fall towards 112.50, and GBPUSD to drop closer to 1.0500.
What Happens to the British Pound: General Election
There is scope for a short-term recovery for the British Pound if it appears that a no-deal, hard Brexit is delayed. This could come in the form of a general election that replaces Brexit hardliner Boris Johnson as UK prime minister. The vote on Tuesday, September 3 should be watched closely to see if the UK parliament is able to retake control of its schedule and avoid prorogation. In the event of a delay in the Brexit process, EURGBP could fall back towards 0.8600, GBPJPY could trade towards 133.00, while GBPUSD could rise towards 1.2600
What Happens to the British Pound: Second Referendum
The only hope that the British Pound has for a significant recover is if Brexit is avoided altogether: after all, it will be impossible to replace the economic activity lost endured from leaving the EU, the world’s largest single market. In the event that the next UK prime minister has a change of heart and takes steps to avoid Brexit (e.g. a second referendum or withdrawing Article 50), EURGBP could fall back towards 0.8300, GBPJPY could rally back towards 145.00, and GBPUSD could climb back towards 1.4000; a full-scale recovery back to pre-June 2016 Brexit vote levels is highly unlikely in the immediate aftermath of the cancellation of Brexit.
FX TRADING RESOURCES
Whether you are a new or experienced trader, DailyFX has multiple resources available to help you: an indicator for monitoring trader sentiment; quarterly trading forecasts; analytical and educational webinars held daily; trading guides to help you improve trading performance, and even one for those who are new to FX trading.
--- Written by Christopher Vecchio, CFA, Senior Currency Strategist
To contact Christopher Vecchio, e-mail at cvecchio@dailyfx.com
Follow him on Twitter at @CVecchioFX
View our long-term forecasts with the DailyFX Trading Guides


