


Bitcoin Price Forecast
Check out our Q3 USD and Gold forecasts . Download for free main currencies and commodities trading guides.
BTC/USD – Hesitant Sellers
On August 6, Bitcoin rallied to 12,318 however, the price slipped back after, then settled below 12,000 handle. This week, BTC/USD traded lower and tested yesterday 9,484 - its lowest level in over two weeks.
Alongside this, the Relative Strength Index (RSI) crossed below 50 however, the oscillator remained flat around 44 reflecting the seller’s indecision to keep sending the price lower.
Just getting started? See our Beginners’ Guide for FX traders
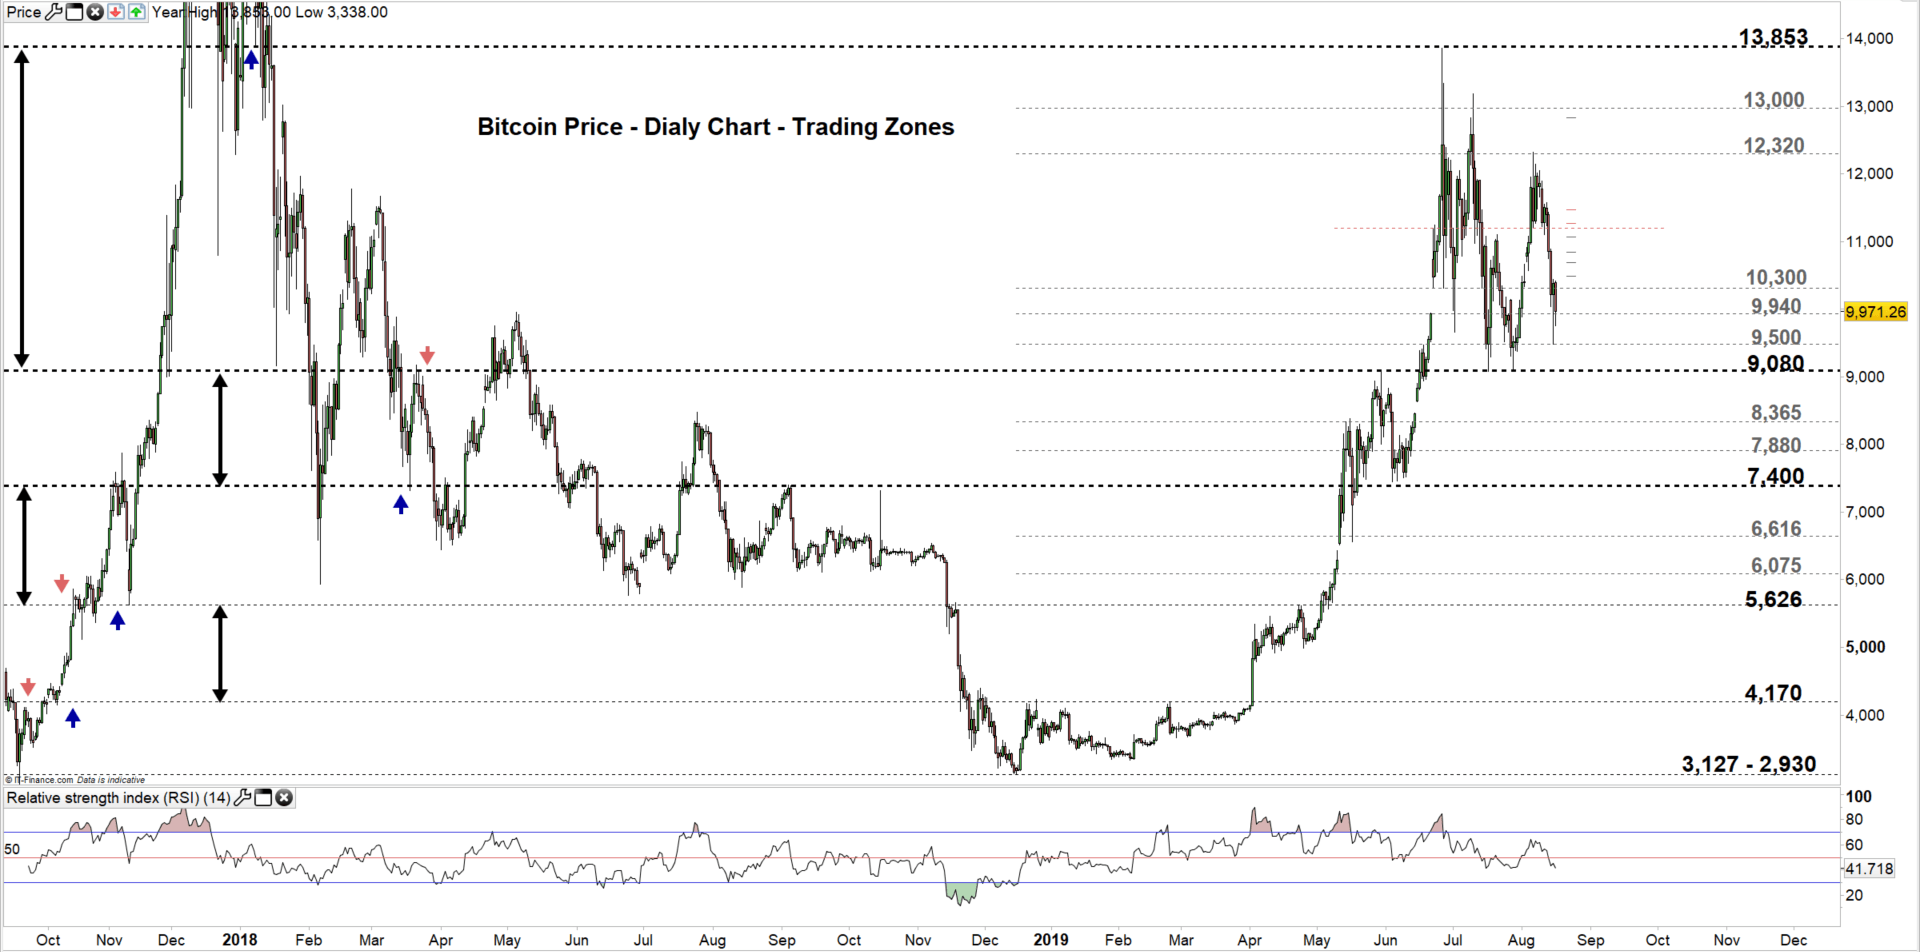
Bitcoin PRICE DAILY CHART (Oct 1– AUG 16, 2019) Zoomed Out
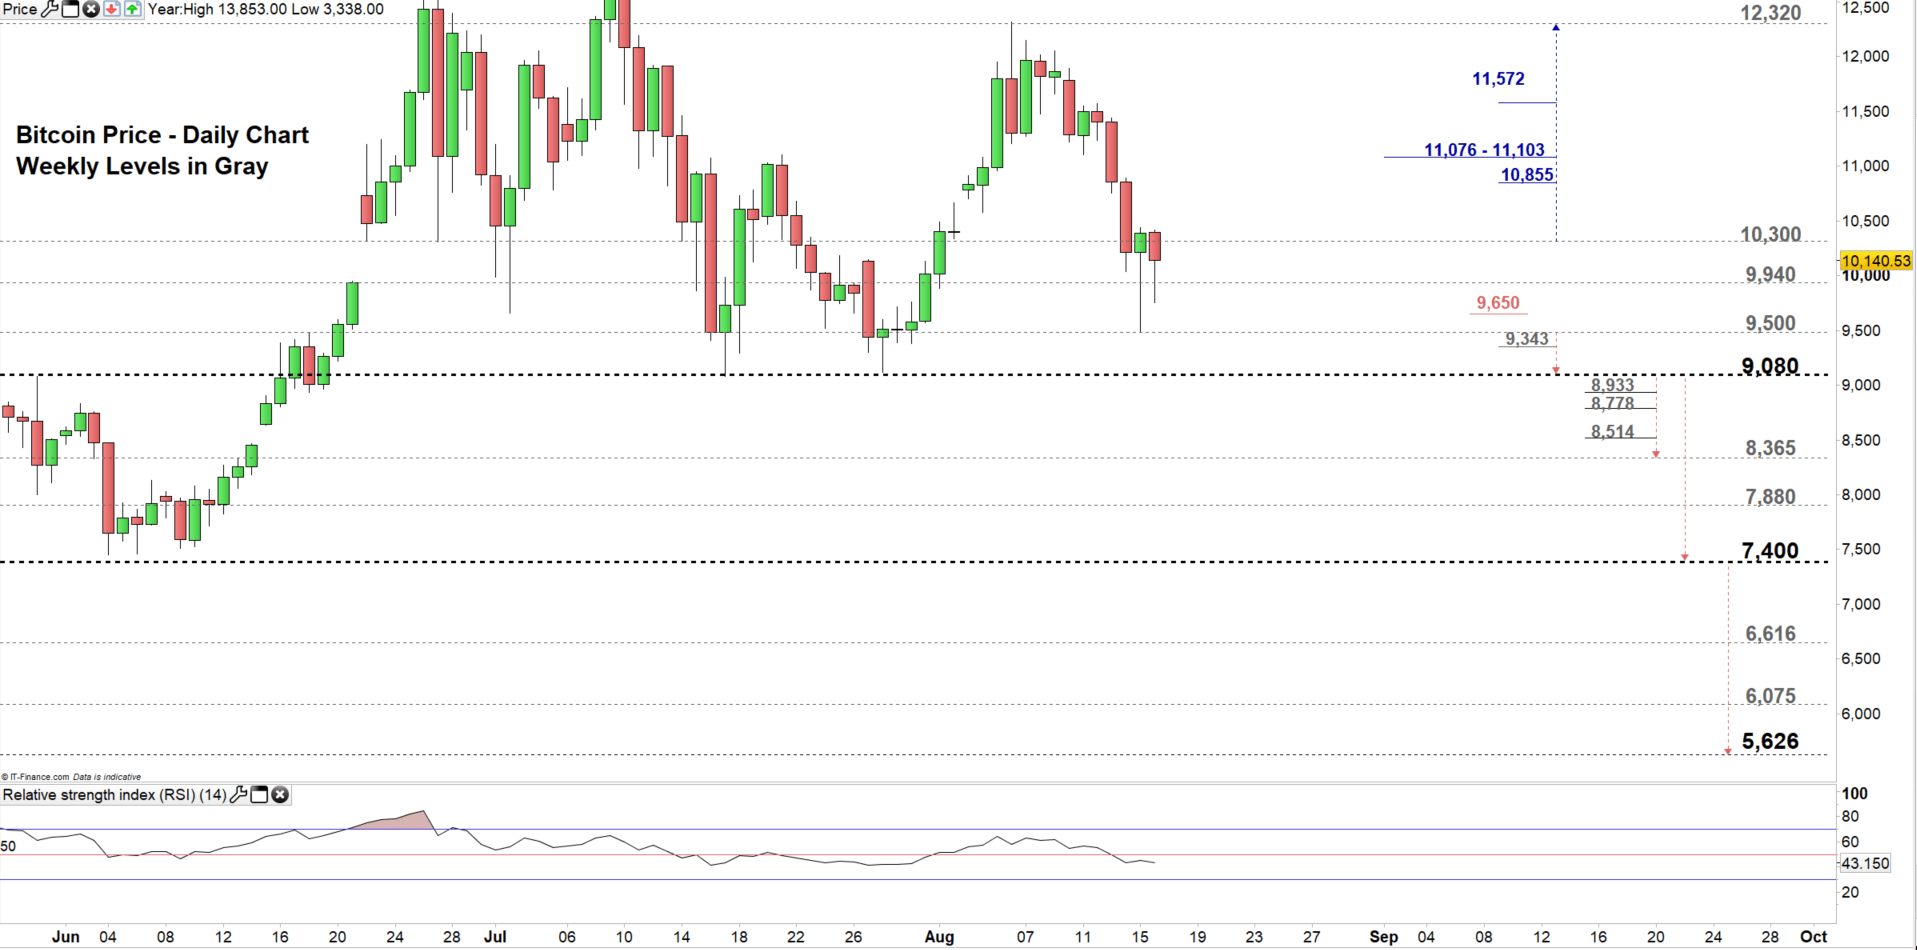
Bitcoin PRICE DAILY CHART (May 28 – AUG 16, 2019) Zoomed In
Looking at the daily chart, we notice yesterday Bitcoin declined to its lowest level since the start of August however, the cryptocurrency rallied after then closed in the higher trading zone 10,300 – 12,320.
Thus, a close above the high end of the zone could push the price towards the high end. Nonetheless, the daily resistance levels and area marked on the chart (zoomed in) need to be considered.
On the flip-side, a close below the low end could press the price to test 9500 again. Although, the daily support level at 9,940 needs to be monitored. Further close below 9500 may send BTC/USD towards the monthly support at 9080. See the chart to know more about the lower trading zone/s with weekly support levels in a further bearish scenario.
Having trouble with your trading strategy? Here’s the #1 Mistake That Traders Make
Bitcoin PRICE FOUR Hour CHART (July 28 – AUg 16, 2019)

Looking at the four-hour chart, we notice on August 12 Bitcoin started a downtrend move creating a lower high at 11,572. Yesterday, BTC/USD rallied and rebounded from 10,439.
Hence, a break above this level may resume bullish price action towards 11,076. Although, the daily resistance underscored on the chart should be watched closely. See the chart to find out more about the next level where the BTC/USD price could pick up.
On the other hand, a break below 9,343 could continue bearish price action towards 8,933. However, the weekly support level at 9,080 would be worth monitoring.
Written By: Mahmoud Alkudsi
Please feel free to contact me on Twitter: @Malkudsi


