


Bitcoin Price Outlook
Check out our Q3 forecasts for USD and Gold . Download for free main currencies and commodities trading guides.
BTC/CAD – Stalled Bullish Momentum
On August 3 Bitcoin opened with an upward gap, indicating to a clear intention from the buyers to continue leading the price. The currency peaked on Tuesday at 12,318- its highest level in nearly five weeks, then slipped back after, and settled below 12,000 handle.
Alongside this, the Relative Strength Index (RSI) crossed above 50, however remained flat around 60 after, indicating to a paused uptrend move.
Just getting started? See our Beginners’ Guide for FX traders
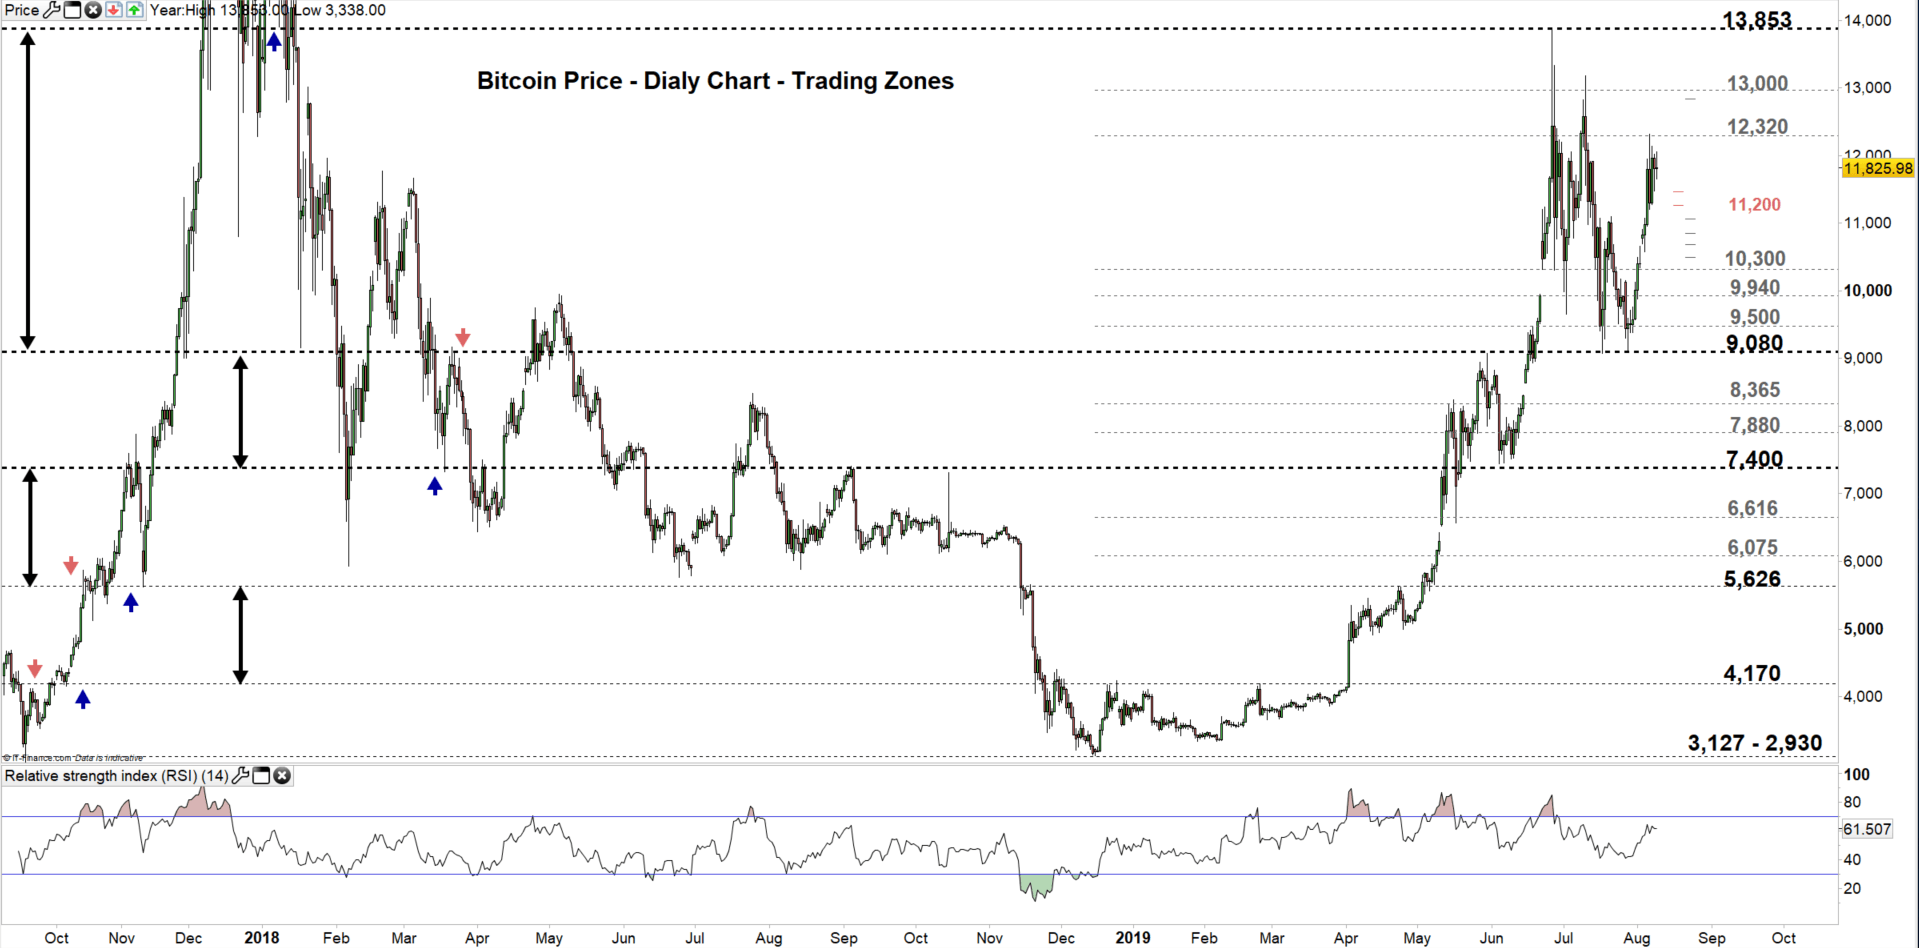
Bitcoin PRICE DAILY CHART (Oct 1– AUG 9, 2019) Zoomed Out
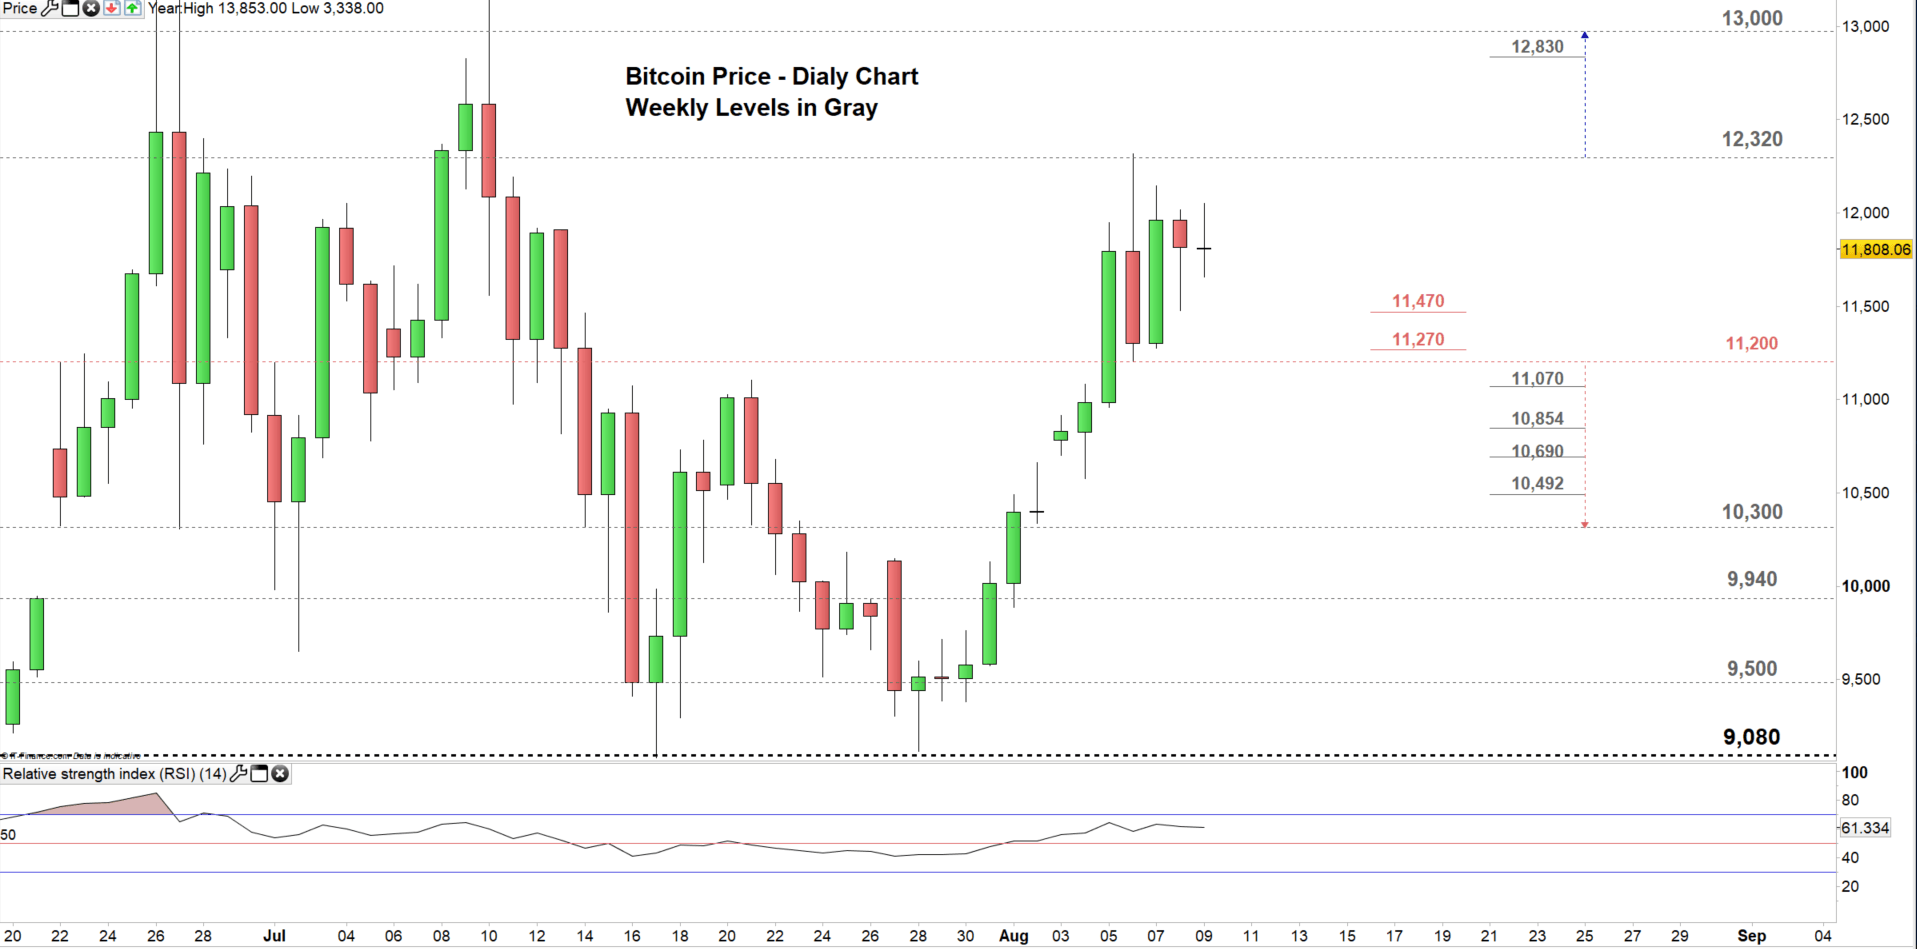
Bitcoin PRICE DAILY CHART (June 20 – AUG 9, 2019) Zoomed In
Looking at the daily chart, we notice on Monday Bitcoin moved to the higher trading zone 11,200 – 12,320. On the following day the price tested and rebounded from the high end of the zone.
Hence, a close above the higher end of this zone could push the price towards 13,000 handle. Although, the weekly resistance underscored on the chart (zoomed in) would be worth monitoring.
On the flip-side, any close below the low end of this zone may send the price towards 10,300. However, the weekly resistance marked on the chart should be watched along the way.
Having trouble with your trading strategy? Here’s the #1 Mistake That Traders Make
Bitcoin PRICE FOUR Hour CHART (AUg 1 – AUg 9, 2019)
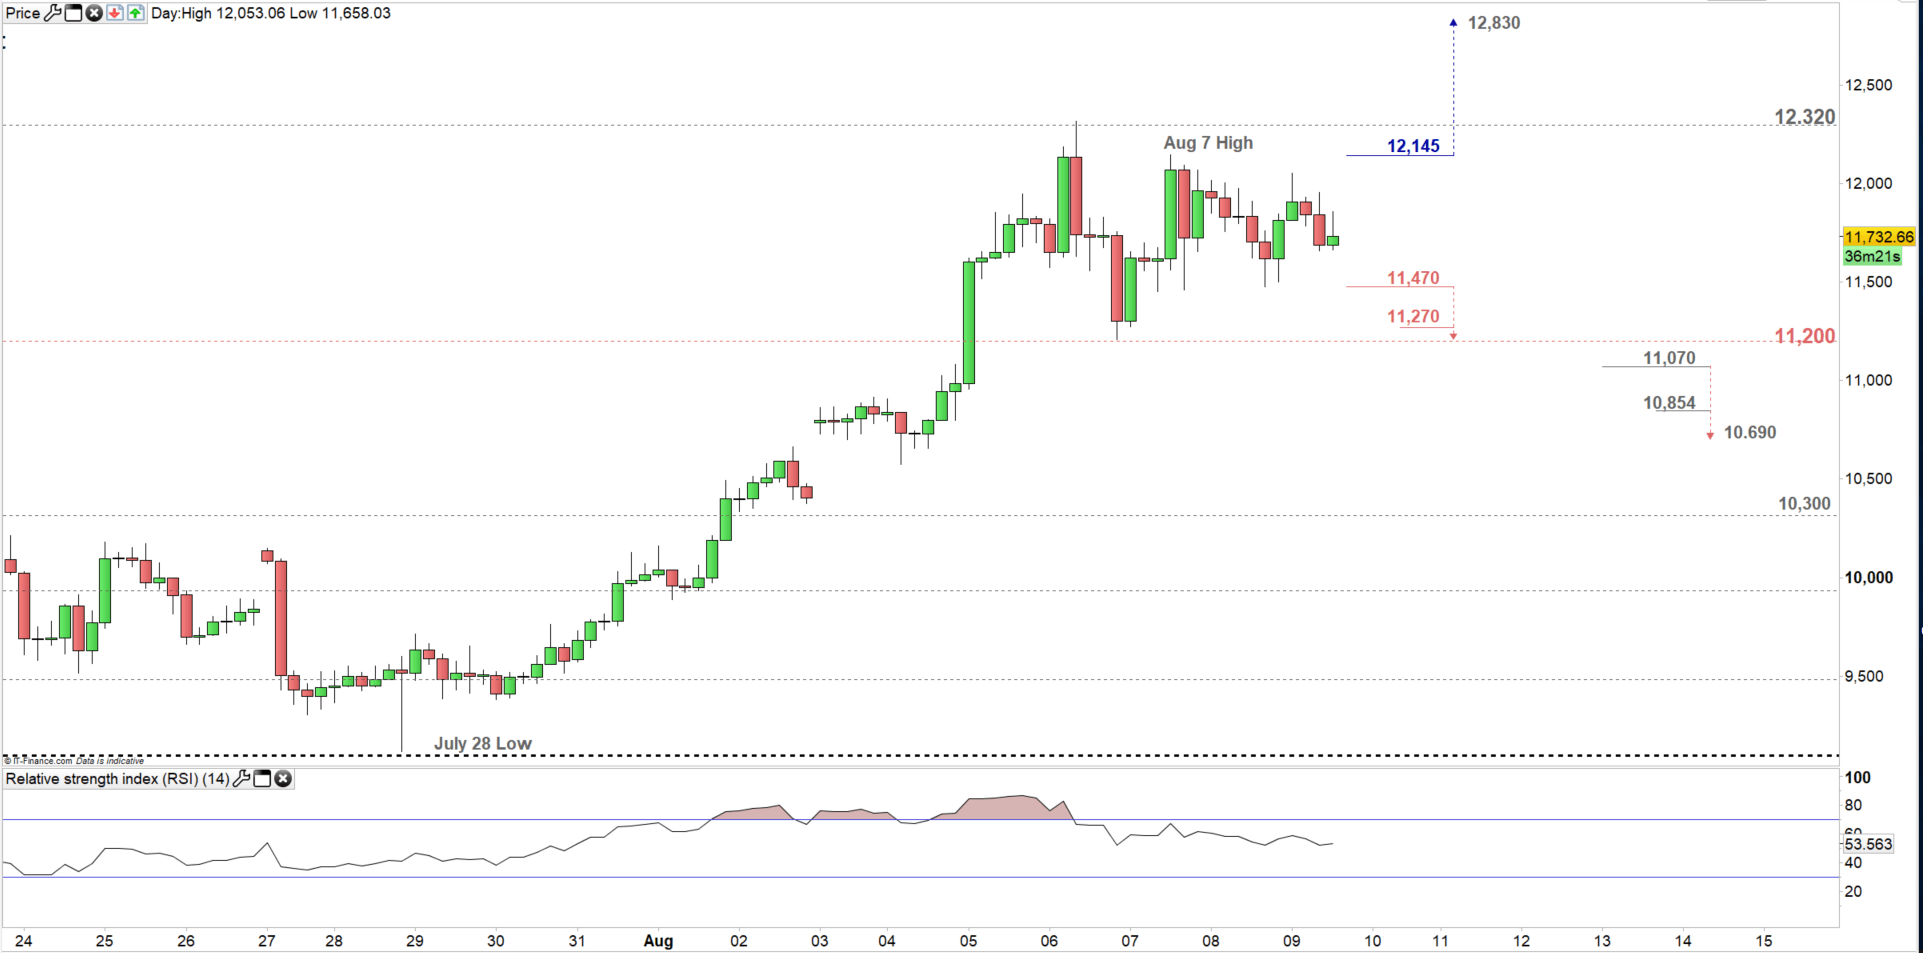
Looking at the four-hour chart, we notice on July 28 Bitcoin rebounded from 9,116 and started a move to the upside, creating higher highs with higher lows. On Wednesday the virtual currency corrected lower creating a lower high at 12,145.
Thus, a break above this high may reignite the uptrend move sending the price towards 12,830. Although the high end of the aforementioned trading zone needs to be considered.
On the other hand, a break below 11.470 could press the price towards the low end of the zone. Nonetheless, the daily support level underlined on the chart should be monitored. See the chart to know more about the lower trading zone with the weekly support levels sellers may encounter in a further bearish scenario.
Written By: Mahmoud Alkudsi
Please feel free to contact me on Twitter: @Malkudsi


