


USD/MYR, USD/SGD, USD/PHP,USD/IDR Talking Points
- USD/MYR may reach new 2019 highs in its uptrend
- Singapore Dollar could weaken more to 2017 levels
- USD/PHP long-term support held as USD/IDR rose
Trade all the major global economic data live as it populates in the economic calendar and follow live coverage for key events listed in the DailyFX Webinars. We’d love to have you along.
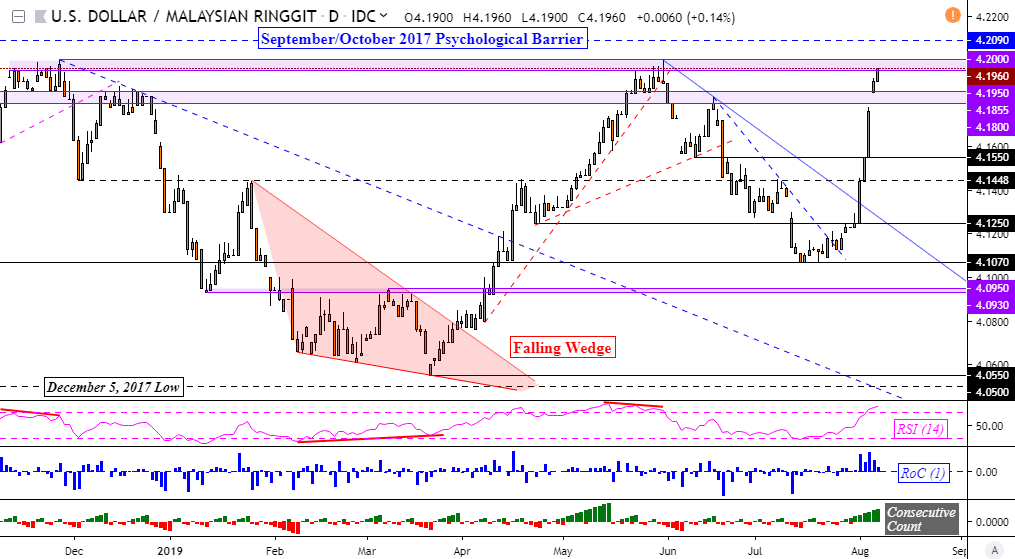
USD/MYR Technical Outlook
The Malaysian Ringgit kept weakening against the US Dollar after last week, USD/MYR took out the descending trend line from May – as anticipated. After clearing multiple resistance barriers, USD/MYR is now sitting right at the next critical psychological range between 4.1950 and 4.2000. A close above it opens the door to testing 4.2090. Otherwise, near-term support appears between 4.1800 and 4.1855.
USD/MYR Daily Chart
USD/SGD Technical Outlook
US Dollar strength against its ASEAN counterparts also extended into the Singapore Dollar, with USD/SGD climbing into resistance which is a range between 1.3808 and 1.3836. Resuming gains opens the door to testing the July and June 2017 highs at 1.3863 and 1.3911 respectively. Otherwise, a turn lower places the focus on the near-term rising support line from July with the next psychological area between 1.3725 and 1.3707.
USD/SGD Daily Chart
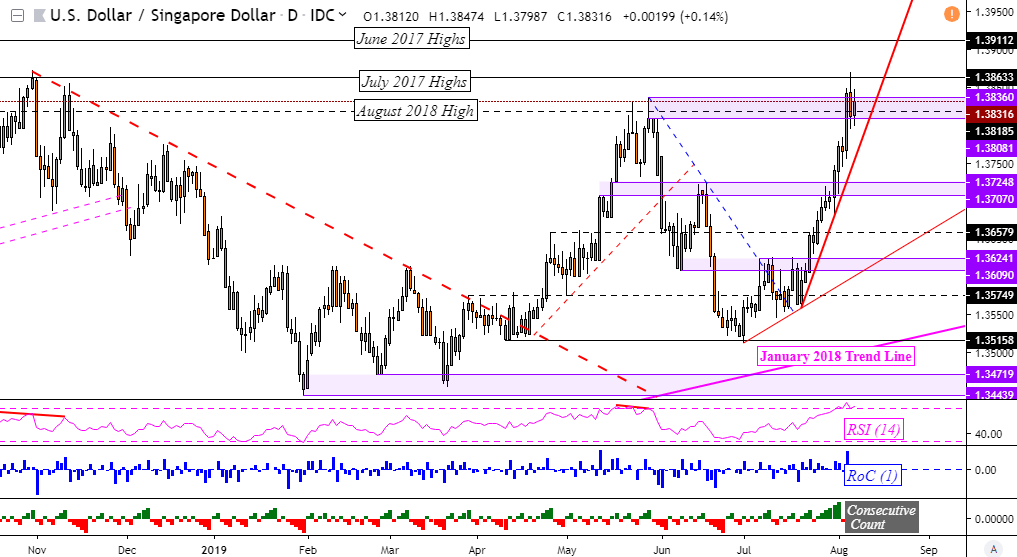
USD/SGD Chart Created in TradingView
USD/PHP Technical Outlook
Meanwhile, the long-term rising support line has kept the USD/PHP uptrend intact going back to 2013. The Philippine Peso is at risk to further losses after falling resistance from March was taken out. This places the focus for USD/PHP on near-term resistance at 52.37 which if taken out, exposes the May peak around 52.73. Otherwise, near-term support appears to be a range between 51.59 and 51.69.
USD/PHP Daily Chart

USD/PHP Chart Created in TradingView
USD/IDR Technical Outlook
A similar technical scenario is also brewing in the Indonesian Rupiah. After July lows held around 13923, USD/IDR surged to the upside as it cleared a descending trend line from late May. The currency pair sits right above support at 14255 with resistance above it at 14340. A close above the latter exposes the May highs which is a psychological barrier between 14482 and 14525.
USD/IDR Daily Chart
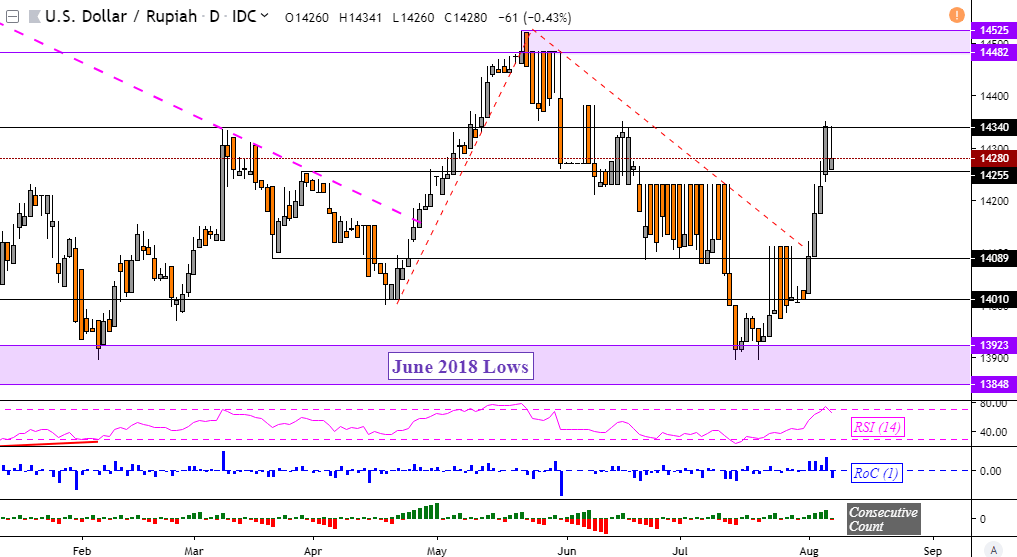
USD/IDR Chart Created in TradingView
FX Trading Resources
- Just getting started? See our beginners’ guide for FX traders
- Having trouble with your strategy? Here’s the #1 mistake that traders make
- See how the US Dollar is viewed by the trading community at the DailyFX Sentiment Page
--- Written by Daniel Dubrovsky, Currency Analyst for DailyFX.com
To contact Daniel, use the comments section below or @ddubrovskyFX on Twitter


