


USD/MYR, USD/SGD, USD/PHP,USD/INR Talking Points
- USD/MYR may reverse the 2-month downtrend
- USD/SGD uptrend may accelerate to May highs
- USD/PHP and USD/INR may follow higher too
Trade all the major global economic data live as it populates in the economic calendar and follow live coverage for key events listed in the DailyFX Webinars. We’d love to have you along.
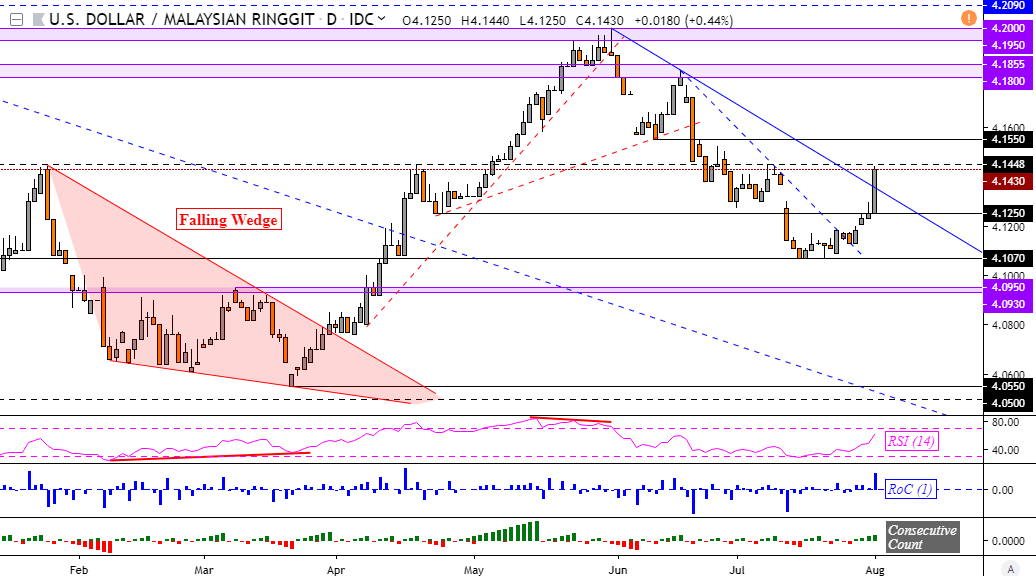
USD/MYR Technical Outlook
The USD/MYR dominant downtrend from the end of May is at risk after the FOMC rate decision fueled gains in the US Dollar. On the first chart below, the Greenback is on course to close at its highest against the Malaysian Ringgit since late June, taking out the falling trend line from late May. Confirming a close above resistance at 4.1448 then exposes 4.1550 with near-term support around 4.1250.
USD/MYR Daily Chart
USD/SGD Technical Outlook
Against the Singapore Dollar, the Greenback is facing a similar situation. The USD/SGD accelerated its uptrend from late June after taking out key resistance last week – as anticipated. After clearing 1.3725 on the chart below, this has exposed the next psychological barrier between 1.3808 and 1.3836 which are the late May highs. This is while being guided higher by the near-term rising trend line from the middle of July.
USD/SGD Daily Chart
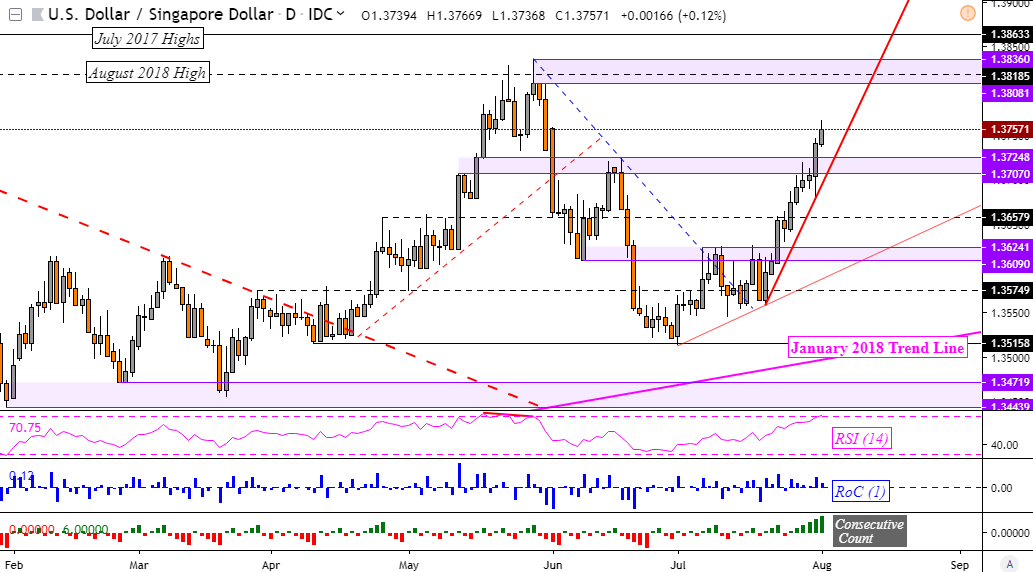
USD/SGD Chart Created in TradingView
USD/PHP Technical Outlook
Lately the Philippine Peso has been in consolidation mode against the US Dollar after bottoming in the middle of July. The USD/PHP is struggling to find its next direction around well-defined, long-term rising support from 2013. Positive RSI divergence on the chart below does show decreasing downside momentum. This may result in a push towards resistance at 51.29 which if cleared, exposes 51.50.
USD/PHP Daily Chart
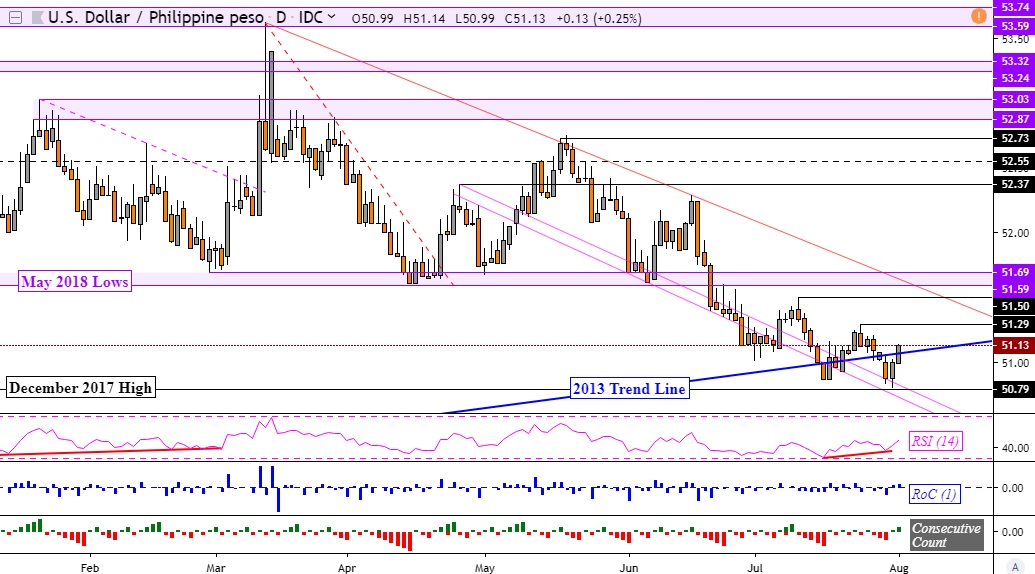
USD/PHP Chart Created in TradingView
USD/INR Technical Outlook
Meanwhile, the US Dollar struggled to make further upside progress against the Indian Rupee as USD/INR approached key resistance barriers. Prices are attempting to push higher into a psychological area that consists of falling trend lines from October and November of 2018. This is marked as the pink area on the USD/INR chart below. Clearing it exposes 69.97 with near-term support at 68.68.
USD/INR Daily Chart

USD/INR Chart Created in TradingView
FX Trading Resources
- Just getting started? See our beginners’ guide for FX traders
- Having trouble with your strategy? Here’s the #1 mistake that traders make
- See how the US Dollar is viewed by the trading community at the DailyFX Sentiment Page
--- Written by Daniel Dubrovsky, Currency Analyst for DailyFX.com
To contact Daniel, use the comments section below or @ddubrovskyFX on Twitter


