


NORDIC FX, NOK, SEK WEEKLY OUTLOOK
- US Dollar strength has catapulted USDSEK, USDNOK above key price levels
- EURSEK broke through descending resistance channel, now at 3-month highs
- For the first time since April, NOKSEK has broken into critical support range
See our free guide to learn how to use economic news in your trading strategy !
USDNOK TECHNICAL ANALYSIS
USDNOK has finally offered some relief to traders with long positions after the pair – in large part due to US Dollar strength – broke above critical resistance which now may once again be support. The pair may resume its previous uptrend along this channel, though testing the upper bound will be a key indication because it may reflect how confident traders are in the pair’s ability to maintain their prior upward-stride.
USDNOK – Daily Chart

Chart created using TradingView
Looking ahead, performing technical analysis may be difficult if fundamental factors – like the deterioration in US-China trade relations – continue to jolt markets and cause significant price moves. This week, USDNOK will likely test the upper bound of rising support (yellow box), and the subsequent reaction will provide insight on how whether this was a bullish spike or a sustainable resumption of the prior uptrend.
USDSEK TECHNICAL ANALYSIS
USDSEK is now briefly retreating after trading at around 17-year highs and is now entering a familiar congestive range (yellow dotted lines) before deciding on whether it will resume its advance or capitulate. The critical juncture will be the intersection of rising support (red channel) and where the congestive range parameters meet. In the week ahead, traders may withhold directional commitment until there is more clarity.
Clarity is Key: Traders May Wait to See Where the Wind Will Blow

USDSEK chart created using TradingView
NOKSEK TECHNICAL ANALYSIS
For the first time since April, NOKSEK has broken into a critical support range (yellow dotted lines) and could struggle to break above the upper lip. A breach below the lower crust of the exposes the pair to another possible floor at 1.0657 (white line). In the week ahead, the pair may trade sideways but could experience violent oscillations if key fundamental developments unfold and cause volatility to spike.
NOKSEK – Daily Chart
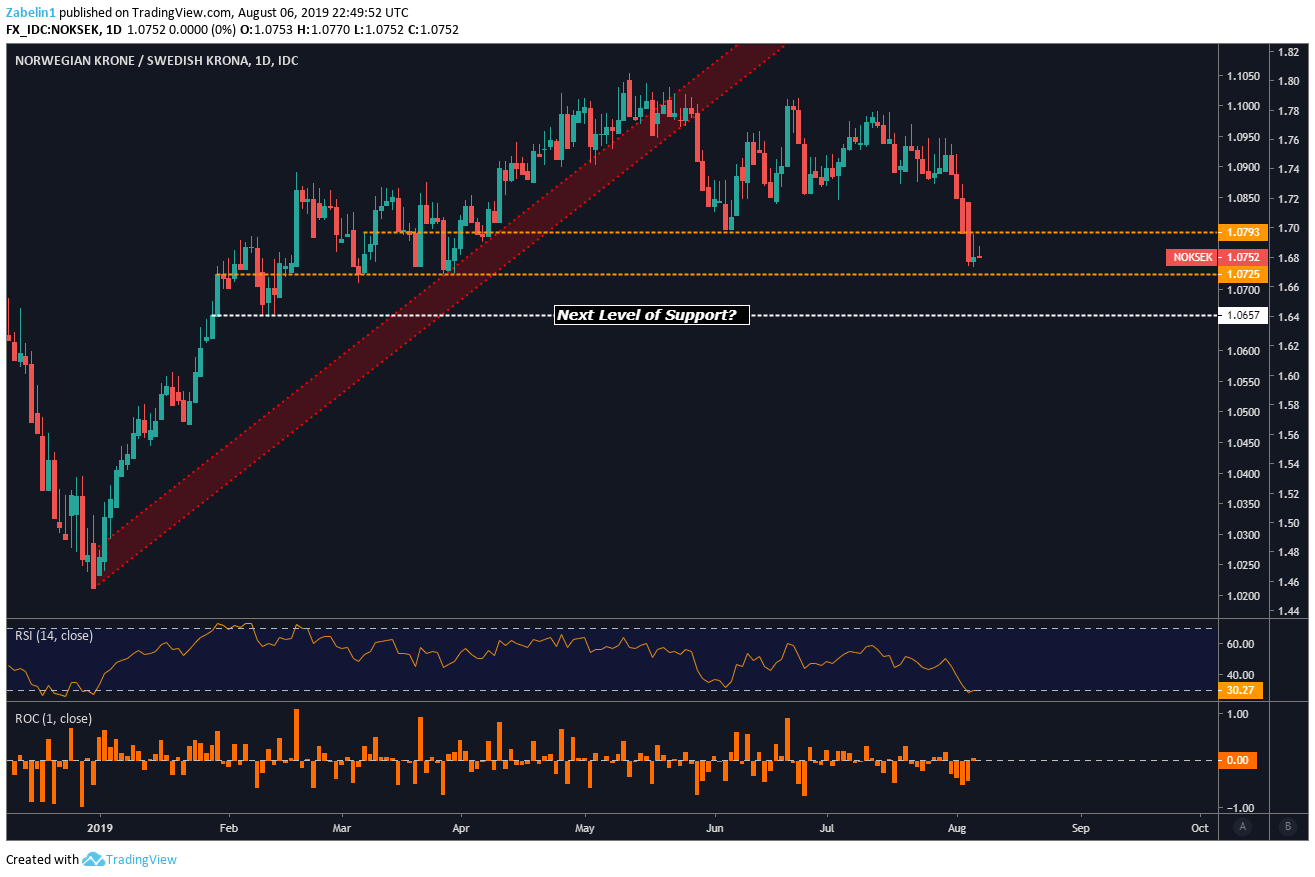
NOKSEK chart created using TradingView
SWEDISH KRONA, NORWEGIAN KRONE TRADING RESOURCES
- Join a freewebinar and have your trading questions answered
- Just getting started? See our beginners’ guide for FX traders
- Having trouble with your strategy? Here’s the #1 mistake that traders make
--- Written by Dimitri Zabelin, Jr Currency Analyst for DailyFX.com
To contact Dimitri, use the comments section below or @ZabelinDimitri on Twitter


